Download
1 / 19
190 likes | 285 Views
Software Performance Engineering - SPE HW - Answers. Steve Chenoweth CSSE 375, Rose-Hulman Tues, Oct 23, 2007. SPE HW – Here was the original example:. You have a system that monitors economic transactions for Amazon.com. Let’s look at critical use cases / scenarios:

E N D
Software Performance Engineering- SPE HW - Answers Steve Chenoweth CSSE 375, Rose-Hulman Tues, Oct 23, 2007
SPE HW – Here was the original example: • You have a system that monitors economic transactions for Amazon.com. • Let’s look at critical use cases / scenarios: • It sees 60,000 transactions per hour (peak hour). • Each validated transaction updates status and activity information in the memory of a server. • You have five displays for people watching. They see exception transactions and statistics. • Oh, and exception transactions need to be shown, too. • These screens should automatically update every 10 seconds. • Every 10 minutes the in-memory info is saved to disk, using SQL-Server. On original slide # 6
SPE HW: And our first analysis • Design looks something like this figure. • 60,0000 trans/hr = 1000 trans/min = 16.7 trans/sec = 60 ms/trans. • Naïvely assume each of the 3 functions on a trans takes equal time. • So, they each have to be done in 20 ms. • But there are also two performance “lumps” – • Updating the 5 displays every 10 sec, and • Writing the memory data to disk every 10 min! Trans Input Stream 60k/hr Trans validate Update stats Update displays 20 ms? Every 10 sec 20 ms? Put in DB Find exceptions 20 ms? Every 10 min On original slide # 7
But we hadn’t yet considered the “lumps” of activity to produce output: • Can you assume that these “lumps” can be tuned out of the system during testing? • Why or why not? Trans Input Stream 60k/hr Trans validate Update stats Update displays 20 ms? Every 10 sec 20 ms? Put in DB Find exceptions 20 ms? Every 10 min On original slide # 8
When we did – this was a better answer: • Not unless you’re used to dealing with such things already! • If not, better budget for them, too: • Divide the 60 ms/trans by 5, not by 3. • Each of the 3 oringinal functions shown gets 12 ms/trans. • Display refresh gets 1/5 of every CPU second, or 200 ms. So 5 displays refreshed every 10 sec = 1 every 2 sec. Each display refresh gets a 400 ms budget. • DB write gets 1/5 of every CPU second, or 200 ms, also. Over 10 min, it then gets 200 * 60 * 10 ms = 2 min of CPU time. But, this had better be distributed evenly! Trans Input Stream 60k/hr Trans validate Update stats Update displays 12 ms 200 ms 12 ms Put in DB Find exceptions 12 ms 2 min On original slide # 9
But…we then added this info: • This is still optimistic! • It assumes you have all the CPU time for your application, and • It assumes your transactions aren’t “lumpy,” and • That the system won’t grow. • A more conservative start would be to cut all the targets in half, on the previous page. On original slide # 10
Result was: Budgets for each programmer, during construction • I’m doing the input validation feature. • I know from day 1 that it has to run in a budget of 50% * 12 ms = 6 ms on each transaction. • I can design to that. • I can test that, at least tentatively, even in unit testing! This will give me estimates to see if I’m “close.” • To do that, I need to “instrument” my code. How? • Real results feed back to the person in charge of the performance spreadsheet. • Their spreadsheet shows if we still meet the requirements targets. • They are also involved in system test, where we get the real results. • We have an informed engineering guess, at all times, about “whether we can make it” on performance. On original slide # 11
We mentioned estimating use of other shared resources • We looked at CPU time. • Other things often budgeted and tracked thru development include “whatever may be of concern,” like: • Memory space • Disk I/O time • Communications time On original slide # 12
And the whole process… • Real risk determines how much time to spend on getting performance (or any other quality attribute) right. • Need to focus on critical use cases / scenarios. • Discover competing needs for resources like CPU time. • Make initial guesses about how to divide these, cycle back and improve on those guesses. • Start simply. • At some point in refinement, however, you have to start considering queuing effects in a more sophisticated way, to be more accurate. • Someone needs to be in charge of the spreadsheet, and of making performance “happen.” • Getting good numbers to start with is a “fall out” advantage of this process. • Most performance successes are due to good design. On original slide # 13
Here was the HW assignment – • Take the architecture we already used as an example. • Now assume that we get the following feedback from the designers of each of the subsystems shown: • The “Trans validate” code is now estimated as only half as complex as the code in the “Update stats” and “Find exceptions” routines. (Time complexity, that is.) • Saving all the statistics to the DB must be one “synchronized” action every 10 min. This is now estimated to take 5 sec. The remaining DB tasks, however, can be distributed evenly over each 10 min interval. • Reallocate the budgets accordingly, assuming we want to be “conservative” and only use 50% of available CPU time! • Make clear any guesses or assumptions you made. • Turn this in as the “Software Performance HW” assignment, by 11:55 PM, Wed, Oct 24. On original slide # 15
So, how to proceed on the HW? You are really given three things to solve here: 1. Being “conservative,” and reallocating what we had, to use only 50% of the whole CPU time. 2. How to handle the fact that “Trans validate” code is now estimated as only half as complex as the code in the “Update stats” and “Find exceptions” routines. And, 3. Saving all the statistics to the DB must be one “synchronized” action every 10 min. This is now estimated to take 5 sec. The remaining DB tasks, however, can be distributed evenly over each 10 min interval.
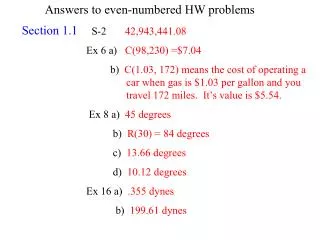
Let’s do the “conservative” one: 1. Being “conservative,” and reallocating what we had, to use only 50% of the whole CPU time, we get half of each figure from “slide 9”: Trans Input Stream 60k/hr Trans validate Update stats Update displays 6 ms (1) 100 ms (2) 6 ms (1) Put in DB Find exceptions 6 ms (1) 1 min (3) • Per transaction. • Per second, for all 5 displays. • Every 10 min, for the DB.
Reallocating the transaction budget times: 2. How to handle the fact that “Trans validate” code is now estimated as only half as complex as the code in the “Update stats” and “Find exceptions” routines: You could have made different assumptions here. Let’s assume you only needed to reallocate the budgets for the 3 routines handling the transactions. We had: 6 ms + 6 ms + 6 ms = 18 ms total. But we now want: x ms + 2*x ms + 2*x ms = 18 ms, where x = Trans validate’s budget. So, 5 * x = 18, and x = 3.6 ms. The other two transaction-related routines each get a new budget of 7.2 ms (instead of 6 ms).
And the whole thing now looks like this: • (Again, we assumed only the transaction-handling budgets were affected here.) Trans Input Stream 60k/hr Trans validate Update stats Update displays 7.2 ms (1) 100 ms (2) 3.6 ms (1) Put in DB Find exceptions 7.2 ms (1) 1 min (3) • Per transaction. • Per second, for all 5 displays. • Every 10 min, for the DB.
Now, what about the DB part? 3. Saving all the statistics to the DB must be one “synchronized” action every 10 min. This is now estimated to take 5 sec. The remaining DB tasks, however, can be distributed evenly over each 10 min interval. This asks us to handle a “lumpy distribution problem.” Let’s assume that the DB statistics action is “synchronized” by locking the table it is writing to the DB. Let’s also figure we still get 1 CPU minute every 10 minutes for all the DB saving activities, so leaves a 60 – 5 = 55 sec budget for the non-stat DB actions. If we get half the CPU time overall for our application, the DB stat action thus “locks out” the other parts of our application for 2*5 = 10 clock seconds in a row, and this happens every 10 minutes. (Or, at least the parts of our app which update the DB from each transaction.)
So, what you need to do is… • Show two pictures of the budgets – • How they look when this synchronized DB stats update is happening, and • How they look when it isn’t happening. • That handles the lumpiness.
Here’s one solution… a. During the 10 sec of time the DB stats update goes on: Trans Input Stream 60k/hr (4) Trans validate Update stats Update displays 0 ms (1) 0 ms (2) 0 ms (1) Put stats In DB Find exceptions 0 ms (1) 5 sec (3) • Per transaction. • Per second, for all 5 displays. • Every 10 min, for the DB. • Assume that transactions simply back up in buffers!
And… b. During the rest of the time: Trans Input Stream 60k/hr Trans validate Update stats Update displays 7.2 ms (1) 100 ms (2) 3.6 ms (1) Put other In DB Find exceptions 7.2 ms (1) 55 sec (3) • Per transaction. • Per second, for all 5 displays. • Every 10 min, for the DB.
So, what was a “good answer” to the HW? • The last 2 figures! • And the assumptions we made to get them. • This accounts for all the required new knowledge (1, 2, and 3) in the HW.