Download
1 / 9
110 likes | 316 Views
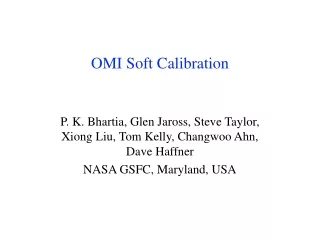
OMI Soft Calibration. P. K. Bhartia, Glen Jaross, Steve Taylor, Xiong Liu, Tom Kelly, Changwoo Ahn, Dave Haffner NASA GSFC, Maryland, USA. Which OMI products are most sensitive to instrument calibration?*** Aerosol index (AI) Aerosol Absorption Optical Thickness (AAOT) Trop O 3 profile.

E N D
OMI Soft Calibration P. K. Bhartia, Glen Jaross, Steve Taylor, Xiong Liu, Tom Kelly, Changwoo Ahn, Dave Haffner NASA GSFC, Maryland, USA
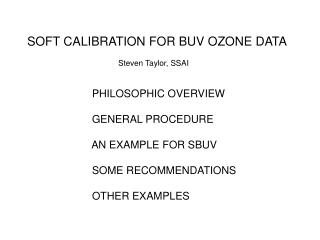
Which OMI products are most sensitive to instrument calibration?*** • Aerosol index (AI) • Aerosol Absorption Optical Thickness (AAOT) • Trop O3 profile What is Soft Calibration? Instrument parameters that are derived by checking consistency against radiative transfer models or by using external data *** DOAS algorithms “soft calibrate” during fitting
l-dep of Aerosol Absorption OC Dust tabs=0.05 Assume 10% abs at 410 nm BC
Detection of Absorbing Aerosols from UV Measurements Nimbus/7 TOMS data blue Solar ZA: 45˚-55˚ Satellite ZA: 0˚-60˚ Azimuth= ~90˚ Solar ZA: 45˚-55˚ Satellite ZA: 0˚-60˚ Azimuth= ~90˚ color Saturation Points shifts up/down & left/right due to aerosol absorption gray Sky brightness • l-independent instrument change will shift points left or right • l- dependent change will shift them up or down
Effect of Swath Angle Anomaly on OMI UV Aerosol Index Pos 41 Pos 54
Effect of Error in Radiance on O3 profile Assumed error: 0% at 329 nm, 1% at 270 nm, linear with l
Straylight error in Col 3 OMI UV1 radiances estimated using MLS O3 profiles 60˚ SZA, Swath Pos 16 Increases with SZA fc>80% fc<10%
Conclusions • OMI UV-AI, AAOT and trop O3 products are very sensitive to instrumental errors. • There are significant calibration (multiplicative) and straylight (additive) errors in OMI UV1 data. MLS O3 profiles can be used to estimate these errors. Since the errors vary with SZA, swath position and cloud fraction, the correction is complicated. • To improve OMI aerosol products we need to analyze errors in UV-AI at locations where there are no (absorbing) aerosols (S. Pacific). Fresnel reflection and water-leaving radiances from oceans have large effect on UV-AI. These effects must be corrected to estimate instrumental errors.