Download
1 / 17
170 likes | 305 Views
The ENSO Signal in Stratospheric Temperatures from Radiosonde Observations. Melissa Free NOAA Air Resources Lab Silver Spring. Recent work confirms ENSO effects on winter surface climate in Europe. slp. Observed surface climate response to ENSO From Ineson & Scaife 2008. Surface T.

E N D
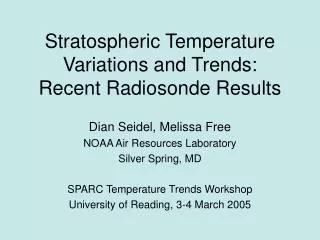
The ENSO Signal in Stratospheric Temperatures from Radiosonde Observations Melissa Free NOAA Air Resources Lab Silver Spring
Recent work confirms ENSO effects on winter surface climate in Europe slp Observed surface climate response to ENSO From Ineson & Scaife 2008 Surface T
This effect may operate through changes in the Arctic stratosphere Weaker polar vortex Warmer arctic stratosphere El Nino North Atlantic Oscillation -less zonal flow Colder European winter
Weak polar vortex is associated with cooling at surface Warm Cold Surface T From Thompson et al. 2002
Previous work 1. Tropics— Several works note cooling in stratosphere during El Ninos, but others found little or no effect in zonal mean satellite temperature. 2. Arctic— Modelsfind warming T and weakening vortex for El Nino winters Sassi et al. 2004 Taguchi and Hartmann 2005 Manzini et al. 2006 (but no signal for La Nina) Ineson and Scaife 2008 Data No significant relation: Hamilton 1993 and other papers Significant only during solar minima: Kryjov and Park 2007 Significant warming at 10 mb: Garfinckel and Hartmann 2007 Significant warming from 10 to 50 mb: Camp and Tung 2007 Depends on phase of Quasi-biennial Oscillation (QBO)?
Data Radiosonde datasets used (1958-2004) Radiosonde Atmospheric Temperature Products for Assessing Climate RATPAC (NOAA) 85 stations Hadley Center Atmospheric Temperatures HadAT2 (UKMO) 676 Iterative Universal Kriging IUK (Yale) 527 Integrated Global Radiosonde Archive IGRA (NCDC) >1000 Indices ENSO index = Nino3.4 SSTs QBO index = 50 mb Singapore winds
RATPAC HadAT2 IUK IGRA
Methods Problem = distinguishing QBO and volcanic effects from ENSO effects (limited number of cases) 1. Linear regression using ENSO and QBO indices Remove QBO first (stepwise multiple r.) Temperatures lagged 4 months behind SSTs 2. Compositing of El Nino versus La Nina years 3. Correlation coefficients (Skip 3post-volcano years)
ENSO temperature signal from regression using all months Pressure (mb) K latitude
ENSO signal from regression using DJF mean temperatures Pressure (mb) T (K)
Arctic signal is strongest in February Pressure (mb) IUK
DJF temperature Compositing warm and cold ENSO events 1. Compositing for all QBO phases K Pressure (mb)
Compositing warm and cold ENSO events-- 2. Compositing for West QBO only Pressure (mb)
Winter mean T at 100 mb for 70-90N with SST3.4 ENSO index K Correlations and explained variance—70-90N
Conclusions • 1. Significant ENSO temperature signal in the tropical stratosphere around 50 mb. • 2. Significant ENSO signal, up to 5 K, in the winter Arctic stratosphere extending into the troposphere, primarily in February. (Consistent with previous work but located lower in atmosphere) • 3. Arctic winter signal is strong for West QBO and absent for East QBO (as in reanalysis studies). • 4. Level of maximum Arctic warming depends on dataset and method of analysis. • Variance in Arctic winter temperature in stratosphere explained by ENSO is ~20% for most datasets.
Remaining issues: Mechanism Why QBO effect? Is the effect limited to sudden stratospheric warmings, or is there a general seasonal warming? [Why no cold European winter in 1997-98?]