Download
1 / 19
190 likes | 255 Views
Topographic Maps. More than a Road Map. What is a Topographic Map?. Scaled representation of features on the surface of the Earth such as roads, rivers, and plains Provides information about land elevations and landforms such as mountains, hills, and depressions. Map Scale.

E N D
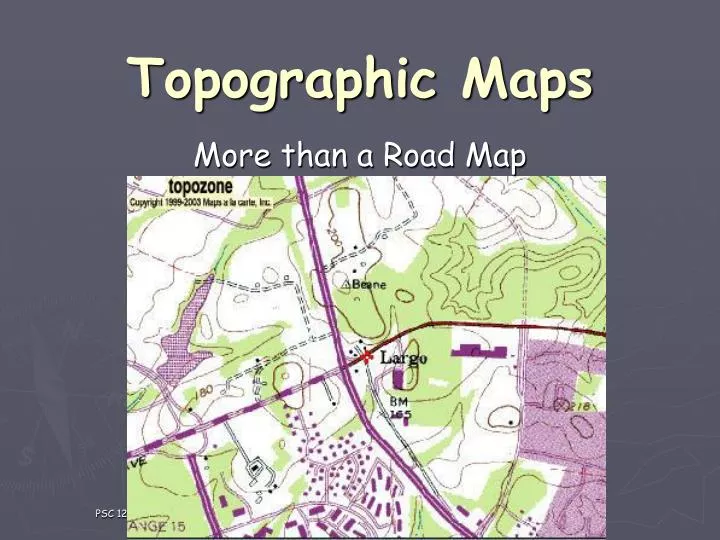
Topographic Maps More than a Road Map PSC 121 Prince George's Community College
What is a Topographic Map? • Scaled representation of features on the surface of the Earth such as roads, rivers, and plains • Provides information about land elevations and landforms such as mountains, hills, and depressions PSC 121 Prince George's Community College
Map Scale Maps always have a scale printed somewhere on the map. For USGS maps it is at the bottom. On USGS the map portion below, the scale is 1:24,000. That means that 1” on the map is 24,000” on the ground or 1’ on the map is 24,000’ on the ground. PSC 121 Prince George's Community College
Map Scale There are also scales that can be used to determine distance for many different units using a ruler and the map scale. 1 mile 1 mile 1/2 mile 2000 feet 1 kilometer 200 feet PSC 121 Prince George's Community College
Contour Lines Elevation is indicated by contour lines. A contour line is a line of equal elevations. All points on a contour line have the same elevation. 800 feet http://raider.muc.edu/~mcnaugma/Topographic%20Maps/contour.htm 700 feet PSC 121 Prince George's Community College
Contour Lines The elevation difference from one line to another is called the contour interval. On the map portion below the contour interval is 20 ft. 20 ft elevation decrease 20 ft elevation increase http://raider.muc.edu/~mcnaugma/Topographic%20Maps/contour.htm 20 ft elevation increase PSC 121 Prince George's Community College
Contour Lines The contour interval is usually printed on a topographic map. However, you can always calculate the interval from the lines with values. PSC 121 Prince George's Community College
Steep or flat? You can tell whether a region on a map is steep terrain (hill/mountain) or relatively flat (plain) by looking at contour lines. HOW? We need to calculate a terrain gradient. This is the change in elevation over the change in distance along the ground. PSC 121 Prince George's Community College
Steep or flat? Elevation change 2170-2150 = 20 feet Gradient 20ft/0.5 mi = 40 ft/mi Flat Elevation change 1380-780 = 600 feet Gradient 600ft/0.5 mi = 1200 ft/mi Steep 0.5 mile distance PSC 121 Prince George's Community College
Contours and Profiles You can generate a profile of a landform from the contour lines on a topographic map. Click on image to see contours develop http://reynolds.asu.edu/topo_gallery/images/hillmap.gif Simple contour map PSC 121 Prince George's Community College
Contours and Profiles From a contour plot we can draw an axis line. We can then drop lines straight down to a grid labeled with elevations to the correct value. http://reynolds.asu.edu/topo_gallery/images/hillmap.gif Connecting the points generates a profile or cross-section of the map. PSC 121 Prince George's Community College
Map Symbols Topographic maps usually have a separate sheet with an explanation of map symbols. There is no room on the map for all the symbols Sample page from USGS Topo Map Symbol Pamphlet PSC 121 Prince George's Community College
Map Symbols Marsh Secondary Highway Houses Forest Stream Intermittent Stream PSC 121 Prince George's Community College
Tracking Flowing Water • How does water always flow? DOWNHILL • How can we tell what direction (N,S,NW,ESE) is downhill? PSC 121 Prince George's Community College
Tracking Flowing Water You can look for elevation changes since water will flow from higher to lower elevations. Here the stream flows toward the northwest. 2000 ft 2100 ft PSC 121 Prince George's Community College
Tracking Flowing Water You can look at the contour lines as they cross the stream. They will always point upstream. Downstream Upstream PSC 121 Prince George's Community College
Tracking Flowing Water You can also look at where two streams merge. The merge will form a V that points downstream. Direction of flow PSC 121 Prince George's Community College
Stream Gradients You can determine a stream gradient along any section of a stream just like a terrain gradient. 2000 ft 2100 ft 0.4 miles PSC 121 Prince George's Community College
Bathymetric Maps Maps of water depths are like topographic maps with contours. However, the contours are water depths, not elevations. PSC 121 Prince George's Community College