Download

1 / 31
310 likes | 373 Views
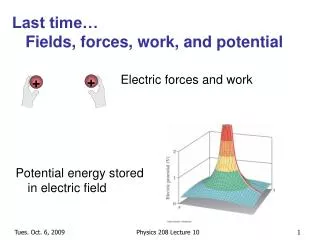
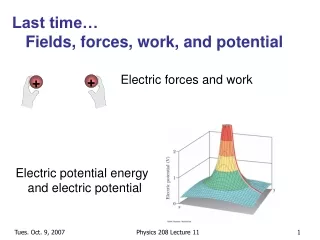
Education and Life time wage potential. Chapter 9 Part 1. 40% 30% 20% 10% 0%. MALE FEMALE. PERCENT COLLEGE GRADUATES. 1940 1950 1960 1970 1980 1990 2000. PERCENT COLLEGE GRADUATES AMONG MEN AND WOMEN, AGE 25-34, 1940-2002.

E N D
Education and Life time wage potential Chapter 9 Part 1
40% 30% 20% 10% 0% MALE FEMALE PERCENT COLLEGE GRADUATES 1940 1950 1960 1970 1980 1990 2000 PERCENT COLLEGE GRADUATES AMONG MEN AND WOMEN, AGE 25-34, 1940-2002
LIFE CYLCE LABOR FORCE PARTICIPATION RATES FOR WHITE WOMEN BY AGE AND BIRTH COHORTTable 9.1, p. 325
AVERAGE YEAR OF WORK EXPERIENCE FOR WORKING WOMEN BY AGE AND YEARTable 9.2, p. 327
$60,000 $50,000 $40,000 $30,000 $20,000 $10,000 $0 MEAN EARNINGS HIGH SCHOOL GRAD COLLEGE GRAD 15 25 35 45 55 65 AGE MEAN EARNINGS BY AGE AND EDUCATION, WOMEN, YEAR-ROUND FULL-TIME WORKERS, 2001 Figure 9.1, p. 316
Life Earnings by Education Level • High School 1.36 million • Vocational Degree 1.71 million • College Degree 2.31 million • Master’s Degree 2.81 million • Ph. D. 3.75 million • Professional Degree 4.29 million
INTERNAL RATES OF RETURN FOR WOMAN’S COLLEGE EDUCATION WITH DIFFERENT WORK FORCE PATTERNS Figure 9.2, p. 317
The Educational Investment Decision • Opportunity Cost of College Career • Direct vs. Indirect Cost of College • Direct • College Tuition • Books • Fees • Indirect • Forgone wage during school years
The Educational Investment Decision College Graduate Gross Benefits High School Graduate Direct Costs Indirect Costs 47 yrs
The Educational Investment Decision with Discontinuous Worker College Graduate Gross Benefits High School Graduate Direct Costs Indirect Costs 47 yrs
So what is the Present Value • First, what is Present Value
So what is the Present Value if the Future Value is growing • What if Value in Future has a growth rate years + Number of Value in the Future ( 1 growth rate ) = + number of years rate ( 1 interest )
So what is the Present Value if the Future Value is growing
So what is the Present Value if the Future Value is growing at different rates between those with college degree and those with no college degree • What if Value in Future has a growth rate
Examples • In the following examples a few assumptions are made: • College cost is covered strictly from de-saving • Person taking off from work returns to exact wage prior to leaving work
College Cumulative Difference Year HS Continous Non-Continous Con-HS Ncon-Hs Ncon-Con 0 $25,000.00 -$15,000.00 -$15,000.00 -$40,000.00 -$40,000.00 $0.00 1 $24,299.07 -$14,018.69 -$14,018.69 -$78,317.76 -$78,317.76 $0.00 2 $23,617.78 -$13,101.58 -$13,101.58 -$115,037.12 -$115,037.12 $0.00 3 $22,955.60 -$12,244.47 -$12,244.47 -$150,237.19 -$150,237.19 $0.00 4 $22,311.99 $43,075.55 $43,075.55 -$129,473.62 -$129,473.62 $0.00 5 $21,686.42 $43,880.70 $43,880.70 -$107,279.34 -$107,279.34 $0.00 6 $21,078.39 $44,700.90 $44,700.90 -$83,656.82 -$83,656.82 $0.00 7 $20,487.40 $45,536.44 $45,536.44 -$58,607.79 -$58,607.79 $0.00 8 $19,912.99 $46,387.58 $46,387.58 -$32,133.20 -$32,133.20 $0.00 9 $19,354.68 $47,254.64 $0.00 -$4,233.24 -$51,487.88 -$47,254.64 10 $18,812.03 $48,137.91 $0.00 $25,092.64 -$70,299.91 -$95,392.55
College Cumulative Difference Year HS Continous Non-Continous Con-HS Ncon-Hs Ncon-Con 11 $18,284.59 $49,037.68 $0.00 $55,845.73 -$88,584.50 -$144,430.23 12 $17,771.94 $49,954.27 $0.00 $88,028.07 -$106,356.43 -$194,384.50 13 $17,273.66 $50,888.00 $0.00 $121,642.41 -$123,630.09 -$245,272.50 14 $16,789.35 $51,839.17 $0.00 $156,692.23 -$140,419.44 -$297,111.67 15 $16,318.62 $52,808.13 $0.00 $193,181.74 -$156,738.06 -$349,919.80 16 $15,861.09 $53,795.20 $0.00 $231,115.85 -$172,599.15 -$403,715.00 17 $15,416.39 $54,800.72 $0.00 $270,500.18 -$188,015.53 -$458,515.72 18 $14,984.15 $55,825.03 $0.00 $311,341.06 -$202,999.68 -$514,340.74 19 $14,564.03 $56,868.49 $24,021.86 $353,645.51 -$193,541.85 -$547,187.37 20 $14,155.70 $57,931.45 $24,470.87 $397,421.27 -$183,226.68 -$580,647.95
College Cumulative Difference Year HS Continous Non-Continous Con-HS Ncon-Hs Ncon-Con 21 $13,758.81 $59,014.28 $24,928.27 $442,676.74 -$172,057.22 -$614,733.96 22 $13,373.05 $60,117.35 $25,394.22 $489,421.04 -$160,036.05 -$649,457.09 23 $12,998.10 $61,241.04 $25,868.88 $537,663.98 -$147,165.27 -$684,829.25 24 $12,633.67 $62,385.73 $26,352.41 $587,416.05 -$133,446.53 -$720,862.58 25 $12,279.45 $63,551.82 $26,844.98 $638,688.41 -$118,881.01 -$757,569.42 26 $11,935.17 $64,739.71 $27,346.75 $691,492.95 -$103,469.43 -$794,962.38 27 $11,600.54 $65,949.79 $27,857.91 $745,842.20 -$87,212.06 -$833,054.27 28 $11,275.29 $67,182.50 $28,378.61 $801,749.41 -$70,108.74 -$871,858.15 29 $10,959.16 $68,438.25 $28,909.06 $859,228.50 -$52,158.84 -$911,387.34 30 $10,651.89 $69,717.47 $29,449.41 $918,294.07 -$33,361.33 -$951,655.40
College Cumulative Difference Year HS Continous Non-Continous Con-HS Ncon-Hs Ncon-Con 31 $10,353.24 $71,020.60 $29,999.87 $978,961.43 -$13,714.70 -$992,676.13 32 $10,062.97 $72,348.08 $30,560.61 $1,041,246.54 $6,782.94 -$1,034,463.60 33 $9,780.83 $73,700.39 $31,131.84 $1,105,166.10 $28,133.96 -$1,077,032.15 34 $9,506.60 $75,077.96 $31,713.74 $1,170,737.47 $50,341.10 -$1,120,396.37 35 $9,240.06 $76,481.29 $32,306.52 $1,237,978.70 $73,407.57 -$1,164,571.13 36 $8,980.99 $77,910.85 $32,910.38 $1,306,908.56 $97,336.96 -$1,209,571.60 37 $8,729.19 $79,367.12 $33,525.53 $1,377,546.49 $122,133.31 -$1,255,413.19 38 $8,484.44 $80,850.62 $34,152.18 $1,449,912.67 $147,801.04 -$1,302,111.63 39 $8,246.56 $82,361.85 $34,790.53 $1,524,027.96 $174,345.01 -$1,349,682.95 40 $8,015.35 $83,901.32 $35,440.82 $1,599,913.93 $201,770.49 -$1,398,143.44
College Cumulative Difference Year HS Continous Non-Continous Con-HS Ncon-Hs Ncon-Con 41 $7,790.62 $85,469.57 $36,103.27 $1,677,592.88 $230,083.14 -$1,447,509.74 42 $7,572.19 $87,067.13 $36,778.10 $1,757,087.82 $259,289.04 -$1,497,798.78 43 $7,359.89 $88,694.56 $37,465.54 $1,838,422.49 $289,394.69 -$1,549,027.79 44 $7,153.54 $90,352.40 $38,165.83 $1,921,621.35 $320,406.99 -$1,601,214.36 45 $6,952.97 $92,041.23 $38,879.21 $2,006,709.61 $352,333.23 -$1,654,376.38 College HS Continous Non-Continous Total $650,630.41 $2,657,340.03 $1,002,963.64 % of HS 100.00% 408.43% 154.15% % of C-Cl 24.48% 100.00% 37.74%
College Cumulative Difference Year HS Continous Non-Continous Con-HS Ncon-Hs Ncon-Con 41 $37,151.87 $407,586.88 $172,169.10 $5,197,072.96 $1,212,819.50 -$3,984,253.46 42 $37,512.57 $431,329.80 $182,198.37 $5,590,890.19 $1,357,505.30 -$4,233,384.89 43 $37,876.77 $456,455.81 $192,811.87 $6,009,469.23 $1,512,440.40 -$4,497,028.84 44 $38,244.51 $483,045.47 $204,043.63 $6,454,270.20 $1,678,239.52 -$4,776,030.68 45 $38,615.81 $511,184.04 $215,929.66 $6,926,838.43 $1,855,553.37 -$5,071,285.06 College HS Continous Non-Continous Total $1,441,044.39 $8,367,882.82 $3,296,597.76 % of HS 100.00% 580.68% 228.76% % of C-Cl 17.22% 100.00% 39.40%
College Cumulative Difference Year HS Continous Non-Continous Con-HS Ncon-Hs Ncon-Con 41 $2,507.30 $27,507.20 $11,619.34 $776,708.11 $18,204.15 -$758,503.97 42 $2,370.54 $27,257.13 $11,513.71 $801,594.70 $27,347.31 -$774,247.39 43 $2,241.24 $27,009.34 $11,409.04 $826,362.80 $36,515.11 -$789,847.69 44 $2,118.99 $26,763.80 $11,305.32 $851,007.61 $45,701.44 -$805,306.17 45 $2,003.41 $26,520.49 $11,202.54 $875,524.69 $54,900.57 -$820,624.12 College HS Continous Non-Continous Total $423,607.59 $1,299,132.28 $478,508.16 % of HS 100.00% 306.68% 112.96% % of C-Cl 32.61% 100.00% 36.83%
College Cumulative Difference Year HS Continous Non-Continous Con-HS Ncon-Hs Ncon-Con 41 $7,790.62 $27,218.59 $15,198.72 $561,102.21 -$98,536.63 -$659,638.84 42 $7,572.19 $26,964.21 $15,056.67 $580,494.23 -$91,052.15 -$671,546.38 43 $7,359.89 $26,712.21 $14,915.96 $599,846.55 -$83,496.08 -$683,342.63 44 $7,153.54 $26,462.56 $14,776.55 $619,155.57 -$75,873.06 -$695,028.63 45 $6,952.97 $26,215.25 $14,638.46 $638,417.85 -$68,187.57 -$706,605.42 College HS Continous Non-Continous Total $650,630.41 $1,289,048.26 $582,442.84 % of HS 100.00% 198.12% 89.52% % of C-Cl 50.47% 100.00% 45.18%
How will this change if • Time taking off from work increases? • College Cost Increases? • There is a college debt?