Download
1 / 27
270 likes | 478 Views
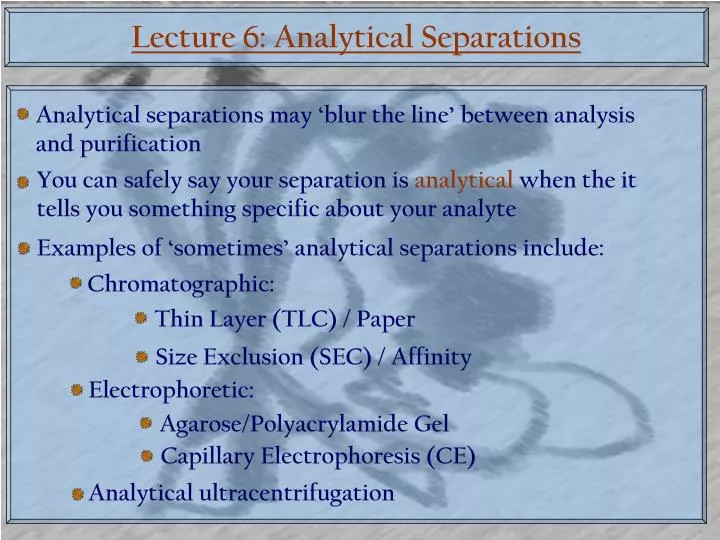
Lecture 6: Analytical Separations. Analytical separations may ‘blur the line’ between analysis and purification . You can safely say your separation is analytical when the it tells you something specific about your analyte. Examples of ‘sometimes’ analytical separations include:.

E N D
Lecture 6: Analytical Separations Analytical separations may ‘blur the line’ between analysis and purification You can safely say your separation is analytical when the it tells you something specific about your analyte Examples of ‘sometimes’ analytical separations include: Chromatographic: Thin Layer (TLC) / Paper Size Exclusion (SEC) / Affinity Electrophoretic: Agarose/Polyacrylamide Gel Capillary Electrophoresis (CE) Analytical ultracentrifugation
The Beginning: Paper Chromatography The unifying aspect of chromatographic methods is that the separation is not with an applied electric field The very first type of chromatography was the ‘adsorption’ variety, which includes paper and TLC Separated chlorophylls and karatenoids using calcium carbonate as the ‘stationary phase’ Mikhail Tsvet 1872-1919 About 20 years later, Richard L.M. Synge and Archer Martin develop paper chromatography and win the nobel prize
N C Adsorption Chromatography Mechanism Adsorption chromatography uses a stationary phase and a mobile phase The stationary phase is usually a solid ‘sheet’ either cellulose (paper), silica gel (standard TLC) or aluminum oxide The stationary phase must have ‘moderately charged’ functional groups: N Cellulose Silica Gel Al2O3
Adsorption Chromatography Mechanism To move the analytes over the stationary phase, we use a non-polar solvent which is drawn up via capillary action Some popular mobile phase solvents are: Non-polar: Alkanes (up to octane), Diethyl ether Moderate polarity: Alcohols, Ketones (not acetone) Polar: H2O, Weak Salt Buffers
TLC and Paper Visualization Once you’ve run the molecule, how do you see it? If you’re very lucky, then your analytes are chromophoric If you’re somewhat lucky, then your analytes absorb UV light If you’re unlucky then you have to use a stain (like iodine)
TLC and Paper Chromatography Nowadays In Biochemistry, TLC and paper chromatography had their heyday in the 50s (Remember Sanger). Nonetheless they are still routinely used as basic analytical tools, particularly in organic chemistry (TLC) We don’t separate proteins this way – electrophoretic separations work much better “Paper Chromatography” 2000-2007: 175 results 1960-1967: 720 results “TLC” 2000-2007: 420 results 1980-1987: 394 results
Column Chromatography: Size Exclusion Adsorption chromatography can also be done on a column, but more for separation than analysis Probably the most common chromatography technique for proteins is ‘size exclusion’ It is also called ‘gel permeation’ chromatography Column is usually agarose beads (i.e. Sephadex™)
Size Exclusion Examples Analytical Size exclusion is usually used to distinguish the oligomeric state of proteins Chromatogram C-CIC-3 Standards Mol. Wt. Standards Stokes Radius Biochemistry (2007), 46 (51): 14996-15008 C-CIC-3 is about 20.5 kDa but the analysis shows 23kDa. Loose structure? J. Biochem. (2006), 139 (5): 813-820
Affinity Chromatography Affinity chromatography comes in a few flavors: Immuno-, Immobilized MetalIon Affinity (IMAC) and just plain affinity (e.g. GST) The difference between this and adsorption is that here the analyte actually sticks to the column until it is washed off Cu2+ / His6 and GST / Glutathione are very common ways of purifying proteins Nonetheless, there are some examples of analytical affinity chromatography
Affinity Chromatography Examples Uses the affinity of glucose for boronate to detect the extent of glucosylation of Ig2 antibodies Anal. Chem. (2007) 79 (24): 9403-9413
TAP Tagging Tandem Affinity Purification (TAP) is a powerful purification technique that analyzes protein/protein interactions Methods (2001) 24, 218–229
Chromatography Instrumentation The Analytical Chromatography instrument is the FPLC The Agilent 1200 System The GE ÄKTA
Electrophoresis Theory Electrophoresis uses an electric current or field to ‘push’ analytes through a medium In the simplest case, the electrophoretic mobility of an analyte e is proportional to the electric field E. In reality, though, electrophoretic mobility has to take into account the ‘double layer’ - solvent ions of oposite charge that cluster around the analyte.
Electrophoresis Theory The effect of the double layer for a given solvent and analyte are incorporated into the zeta potential term . Where is the dielectric constant of the solvent, 0 is the permitivity of the vaccum (8.85*10-12) and is the dynamic vicocity So far we have assumed that we are dealing with particles whose size is on the order of the double layer. But our analytes are much bigger. In this case, we are more concerned with the stokes radius relative to the amount of charge. Where z is the charge, is the viscosity and r is the Stokes radius
Electrophoresis of Nucleic Acids If we’re trying to separate nucleic acids, we have a problem because: They are always negatively charged at neutral pH. All molecules will travel in the same direction Each additional nucleoside confers an additional charge, so charge is directly proportional to size. All molecules will have the same e The solution is to use a gel which consists of pores surrounded by cross-linked fibers This will make e dependent on the Stokes radius EM image of Agarose Gel
DNA/RNA Electrophoresis Double stranded DNA or RNA are molecules that repel themselves. They will all form rod-like structures. So now we can separate our nucleic acids on the basis of size. We can visualize with a fluorescent dye (usually ethidium bromide) and compare to a standard to get a relatively good quantitative size: Electropherogram Single stranded DNA or RNA may interact with itself forming a ‘supercoil’. e for supercoiled DNA or RNA is a mite unpredictable.
Protein Electrophoresis Proteins are even trickier than DNA/RNA: They are all effectively supercoiled (3° Structure) They can be either positively or negatively charged The number of charges depends on the amino acid sequence and is not proportional to size. The solution is to expose the protein so a detergent (usually sodium dodecyl sulphate - SDS) +ve -ve
Protein Electrophoresis Proteins will bind an amount of SDS roughly proportional to their size (1.4g/g polypeptide), so we have effectively created the same situation as for DNA/RNA electrophoresis. The ‘gel of choice’ for SDS-page protein electrophoresis is polyacrylamide. Danger! Acrylamide monomers are potent neurotoxins The ‘Standard’ ladder The Over-Expressed protein of interest? Sometimes proteins are pre-boiled in a reducing agent to eliminate S-S. Proteins are visualized using a dye (coomassie blue) or other stain (silver)
2D Electrophoresis If you want to analyze the whole protein content of a cell, a 1D separation just isn’t gonna do it. The solution is to do a 2D separation using a gel that has a pH gradient. Proteins will run on this gel (in both directions) until they hit their isoelectric point where they aggregate Then you can soak the gel in SDS, flip the voltage 90° and separate by size. +ve -ve
2D Gels 2D Electrophoresis is a powerful tool for analyzing the protein complement of simple cells
Capillary Electrophoresis You can also make molecules pass through a narrow (usually fused silica) capillary Typically, your analyte is in a buffer with net +ve charge, which generates an electroosmotic flow (EOF) towards the cathode EOF overpowers e, thus all analytes move towards the cathode at rates dependent on their e
Capillary Electrophoresis The advantages of CE are: Really good separation of slow diffusing analytes Where: e is the difference inapparent electrophoretic mobility, is the average electrophoretic mobility, V is the applied voltage and D is the diffusion coefficient Resolution is limited by Diffusion coefficient and flow rate Very, very low sample consumption
Analytical Ultracentrifugation In analytical ultracentrifugation, analytes are separated on the basis of their sedimentation when they experience a centripetal force. Usually carried out at speeds around 60,000
Analytical Ultracentrifugation Or, described mathematically… angular velocity radius from center of spin mass of a single molecule This is counteracted by the Boyant force (due to displacement of solute) and the frictional force sedimentation velocity coefficient of friction mass of solute displaced Solvent density in g/mL Sedimentation coefficient Volume occupied by 1g of solute
Sedimentation Velocity Experiments The most basic type of ultracentrifugation experiment is to measure the rate at which the analyte moves away from the center of rotation What is actually measured is the movement of the boundary between dissolved analyte and ‘empty’ buffer
Sedimentation Equilibrium In sedimentation equilibrium, an equilibrium is established between sedimentationaway from the center of rotation and diffusion towards the center of rotation.
Density Gradient Centrifugation Density gradient is similar to equilibrium sedimentation except there is a permanent solvent density gradient. This sharpens the contrast between the sedimentation equilibria of samples with the same shape, but slightly different masses: Meselson and Stahl, P.N.A.S., 44, (1958), 671-682)