1 / 0

So far..

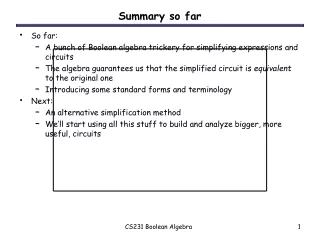
So far. We have covered Requirements gathering: observation & interview. Requirements specification. Requirements validation. Design/paper prototyping in this case. Architecture. Effort analysis and scheduling. OUTLINE . Monday : design gallery (with modifications)

rumor
Download Presentation

So far..

An Image/Link below is provided (as is) to download presentation Download Policy: Content on the Website is provided to you AS IS for your information and personal use and may not be sold / licensed / shared on other websites without getting consent from its author. Content is provided to you AS IS for your information and personal use only. Download presentation by click this link. While downloading, if for some reason you are not able to download a presentation, the publisher may have deleted the file from their server. During download, if you can't get a presentation, the file might be deleted by the publisher.

E N D

Presentation Transcript


  1. So far.. We have covered Requirements gathering: observation & interview. Requirements specification. Requirements validation. Design/paper prototyping in this case. Architecture. Effort analysis and scheduling.
  2. OUTLINE Monday : design gallery (with modifications) Thursday: Meet with your consumers to present your second design Final exam on Thursday 8/12/2010 Assignments: Monday - architecture assignment submission. Final submission: SR template (due Friday midnight 8/6/2010)
  3. Today Scheduling and how to go about it. As we saw in the previous lecture, there are basically three kinds of costs that are normally associated in projects. Hardware costs Training and travel cost Effort cost We also noted that effort cost was the most important and hard to calculate. So we will focus on calculating that today.
  4. Different metrics You could use any of the below techniques or a mix and match of them to determine your effort cost and hence set a schedule. Algorithmic cost modeling Base estimate on project size (lines of code) Expert judgment Ask others Estimation by analogy Cost based on experience with similar projects Now that you have the architecture of the system, you are setting your schedule for the development /implementation , testing phases of that system. You now ought to make some realistic analysis of what parts of it can be implemented and what you might have to skip. You are allowed to estimate the time period ( you just cannot say as long as it takes, you must make a realistic estimation)
  5. Productivity metrics Lines of code Simple, but not very meaningful metric Easy to pad, affected by prog language How to count revisions/debugging etc? Function points Amount of useful code produced (goals/requirements met) Less volatile, more meaningful, not perfect
  6. Function points Function points are computed by first calculating an unadjusted function point count (UFC). Counts are made for the following categories (Fenton, 1997): External inputs – those items provided by the user that describe distinct application-oriented data (such as file names and menu selections) External outputs – those items provided to the user that generate distinct application-oriented data (such as reports and messages, rather than the individual components of these) External inquiries – interactive inputs requiring a response External files – machine-readable interfaces to other systems Internal files – logical master files in the system Each of these is then assessed for complexity and given a weighting from 3 (for simple external inputs) to 15 (for complex internal files).
  7. Unadjusted Function Point Count (UFC) Each count is multiplied by its corresponding complexity weight and the results are summed to provide the UFC
  8. Object points Similar to function points (used to estimate projects based heavily on reuse, scripting and adaptation of existing tools) Number of screens (simple x1, complex x2, difficult x3) Number of reports (simple x2, complex x5, difficult x8) Number of custom modules written in languages like Java/C x10
  9. Choosing the productivity metric Choose the most appropriate of the three and give a reasoning on why you chose it. Object points Function points LOC
  10. Today’s activity Similar to the example in the previous lecture. Follow the following steps: A) Draw an activity graph along with dependencies. B) Set milestones. C) Determine the person-month effort to reach each milestone ( You can determine this in any way you want to of the three methods: asking an expert, making an estimation, or looking at similar previous tasks)
  11. Example Gantt chart What I finally want!
More Related