Download
1 / 31
370 likes | 711 Views
Introduction to Operating Systems: Module 13. CPU Scheduling. Overview. Basic concepts Short, medium, long term scheduling Scheduling criteria Scheduling algorithms Advanced scheduling Multiple-processor scheduling Real-time scheduling Algorithm evaluation methods. Basic Concepts.

E N D
Introduction to Operating Systems: Module 13 CPU Scheduling
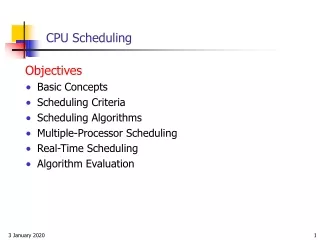
Overview • Basic concepts • Short, medium, long term scheduling • Scheduling criteria • Scheduling algorithms • Advanced scheduling • Multiple-processor scheduling • Real-time scheduling • Algorithm evaluation methods
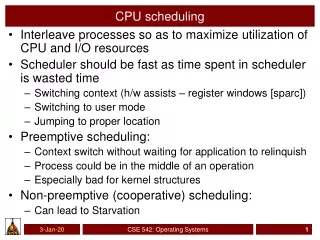
Basic Concepts • During its life, a process alternately executes instructions and waits for resources availability • Interactive processes spend most of their time waiting for user input; this doesn't require use of the CPU • CPU–I/O Burst Cycle – Process execution consists of a cycle of CPU executions and I/O waits • Most CPU bursts are very short, but occasionally processing requires an extended CPU burst • This behavior can be described as exponentially distributed
Histogram of CPU-burst Times Many short CPU bursts Frequency Few long CPU burst Burst duration
terminated Process states create dispatch running activate terminate ready inactive preempt block suspend waiting wakeup
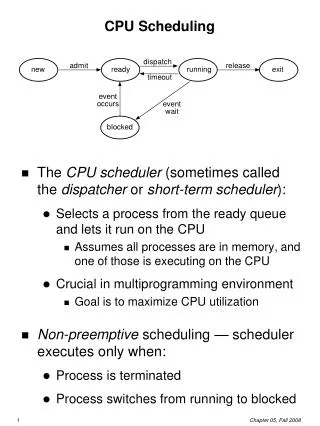
Short-term CPU Scheduler • Selects from among the processes (threads) in memory that are ready to execute, and allocates the CPU to one of them • CPU scheduling decisions may take place when some process (not necessarily the running process): • Switches from running to waiting state • Switches from running to ready state 3. Switches from waiting to ready 4. Terminates • Scheduling using only 1 and 4 is non-preemptive • All other scheduling is preemptive
Dispatcher • Dispatcher module gives control of the CPU to the process (thread) selected by the short-term scheduler; this involves: • switching PCB contents to/from registers • Not needed when switching between threads in the same task • switching to user mode • jumping to the proper location in the user program to restart that program • Dispatch latency – time it takes for the dispatcher to stop one process and start another running
Medium-term process scheduler • Manages the degree of multiprogramming • We need to prevent thrashing • If system resources allow it, choose a suspended process to be re-activated, loading its context from disk into memory and placing it in a non-suspended state • The active process will now be able to execute on the CPU
Long-term process scheduling • Controls the creation of new processes • Admission to the system may be delayed until sufficient resources are available • The long term scheduler acts to control the degree of multiprogramming so that active processes need not be suspended to avoid thrashing
Short-term scheduling metrics • CPU utilization: user process time/total time • Throughput rate: # processes that finish/time • Turnaround time: amount of time to execute a process • Waiting time: time a process has been in the ready queue • Response time: amount of time it takes from when a request was submitted until the first response is produced
Optimization Criteria • Maximize CPU utilization • Maximize throughput rate • Minimize average turnaround time • Minimize average waiting time • Minimize response time
First-Come, First-Served Scheduling • Example: ProcessBurst Time P1 24 P2 3 P3 3 • Suppose that the processes arrive in the order: P1 , P2 , P3 The Gantt Chart for the schedule is: • Waiting time for P1 = 0; P2 = 24; P3 = 27 • Average waiting time: (0 + 24 + 27)/3 = 17 P1 P2 P3 0 24 27 30
FCFS Scheduling Suppose that the processes arrive in the order P2 , P3 , P1 . • The Gantt chart for the schedule is: • Waiting time for P1 = 6;P2 = 0; P3 = 3 • Average waiting time: (6 + 0 + 3)/3 = 3 • Much better than previous case • Convoy effect short process behind long process P2 P3 P1 0 3 6 30
Shortest Process Next (SPN) Scheduling • Associate with each process the length of its next CPU burst. Use these lengths to schedule the process with the shortest time. • Two schemes: • Non-preemptive (SPN) – once CPU given to the process it cannot be preempted until completes its CPU burst. • Preemptive – if a new process arrives with CPU burst length less than remaining time of current executing process, preempt. This scheme is know as the Shortest-Remaining-Time-First (SRTF). • SPN is optimal among non-preemptive schedulers– gives minimum average waiting time for a given set of processes. • SRTF is waiting-time optimal over all schedulers
Idea for Proof • Look at the average cost for shortest job next (we can look at just the sum). • Assume t1<t2<…<tn are service times. • Wait time=(t1)+(t1+t2)+(t1+t2+t3) +…+(t1+t2+…tn). • Rearranging W=
Example of (Non-Preemptive) SPN ProcessArrival TimeBurst Time P1 0.0 7 P2 2.0 4 P3 4.0 1 P4 5.0 4 SPN average waiting time = (0 + 6 + 3 + 7)/4 = 4 P1 P3 P2 P4 0 3 7 8 12 16
P1 P2 P3 P2 P4 P1 0 2 4 5 7 11 16 Example of (Preemptive) SRTF ProcessArrival TimeBurst Time P1 0.0 7 P2 2.0 4 P3 4.0 1 P4 5.0 4 SRTF average waiting time = (9 + 1 + 0 +2)/4 = 3
Determining Length of Next CPU Burst • Can only estimate the length • Use the length of previous CPU bursts • exponential averaging
Examples of Exponential Averaging • =0 • n+1 = n • Recent history carries no weight • =1 • n+1 = tn • Only the actual last CPU burst carries weight
Examples of Exponential Averaging • If we expand the formula, we get: n+1 = tn+ (1 - ) tn-1 + … + (1 - )j tn-j + … + (1 - )n-1 t2 + (1 - ) nt1 • Since both and (1 - ) are less than or equal to 1, each successive term has less weight than its predecessor
Priority Scheduling • A priority number (integer) is associated with each process • The CPU is allocated to the process with the highest priority (smallest integer highest priority) • both preemptive & non-preemptive are possible • SPN can be viewed as priority scheduling • priority is the next CPU burst duration • Starvation: low priority process may never execute • Solution: Aging – as time progresses, increase the priority of processes that are ready (waiting for the CPU)
Round Robin (RR) • Each process gets a small unit of CPU time. After this time has elapsed, the process is preempted and added to the end of the ready queue • If there are n processes in the ready queue and the time quantum is q, then each process gets 1/n of the CPU time in chunks of at most q time units at once. No process waits more than (n-1)q time units • Performance • q large FIFO • q small q must be large with respect to context switch, otherwise overhead is too high
P1 P2 P3 P4 P1 P3 P4 P1 P3 P3 0 20 37 57 77 97 117 121 134 154 162 RR with Time Quantum = 20 ProcessBurst Time P1 53 P2 17 P3 68 P4 24 • The Gantt chart is: • Typically, higher average turnaround than SPN, but better response.
Highest response ratio next • A form of dynamic priority scheduling where a process priority is calculated by R = 1 + w/s. • R is response ratio • W is time spent waiting for the CPU • S is the expected duration of the next CPU burst, or service time • Doesn't really work as a preemptive algorithm; why? • Use time remaining on burst for duration of the next burst for the currently running process • Requires estimation of the service time
Example of HRRN ProcessArrival TimeBurst Time P1 0.0 7 P2 2.0 4 P3 4.0 1 P4 5.0 4 HRRN average waiting time = (0 + 6 + 3 +7)/4 = 4 P1 P3 P2 P4 0 7 8 12 16
Multilevel Feedback Queue • Ready queue is partitioned into separate queues: • Processes just starting their current CPU burst are in higher priority queues • Once they exceed the burst duration for that queue they are demoted • Processes on the same burst for a long time are in lower priority queues • Scheduling must be done between the queues • Fixed priority scheduling • serve all from processes in higher priority before those in low priority queues • Possibility of starvation • Time slice – each queue gets a certain amount of CPU time which it can schedule amongst its processes • 40% to queue 1 • 20% to queue 2 • Etc. • To prevent starvation as new processes enter the system, queue durations could double at each level
Example: Multilevel Feedback Queue • Three queues: • Q0 – time quantum 8 milliseconds • Q1 – time quantum 16 milliseconds • Q2 – FCFS (i.e. time quantum is infinite) • Scheduling • A new job enters queue Q0which is servedFCFS • When it gains CPU, job receives 8 milliseconds • If it does not finish in 8 milliseconds, job is moved to queue Q1 • At Q1 job is again served FCFS and receives 16 additional milliseconds. • If it still does not complete, it is preempted and moved to queue Q2
Multiple-Processor Scheduling • CPU scheduling more complex when multiple CPUs are available • Homogeneous processors within a multiprocessor • Load sharing • Asymmetric multiprocessing – only one processor accesses the system data structures, alleviating the need for data sharing
Real-Time Scheduling • Hard real-time systems – required to complete a critical task within a guaranteed amount of time • Soft real-time computing – requires that critical processes receive priority over less fortunate ones
Algorithm Evaluation • Deterministic modeling – takes a particular predetermined workload and defines the performance of each algorithm for that workload • Simulation: stochastic work load • Queuing models: mathematical results • Implementation
Evaluation of CPU Schedulers by Simulation performance statistics for FCFS simulation FCFS *** CPU 10 I/O 213 CPU 12 I/O 112 CPU 2 I/O 147 CPU17 *** actual process execution performance statistics for SJF simulation SJF trace tape performance statistics for RR(Q = 14) simulation RR(Q = 14)