Download
1 / 43
440 likes | 586 Views
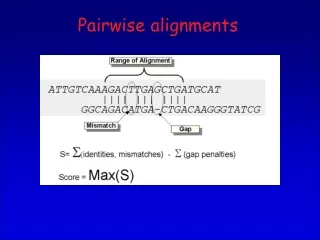
Pairwise Alignments and Sequence Similarity-Based Searching. "Anatomy" of a Sequence Alignment. residues. residues. Sequences: List of residues in a polymer chain... ...listed in the same order they occur within the polymer. Residues:

E N D
"Anatomy" of a Sequence Alignment residues residues Sequences: List of residues in a polymer chain... ...listed in the same order they occur within the polymer Residues: Monomers within a polymer (polypeptide or polynucleotide) chain sequences WKKLGSNVG WGKVKNVD
"Anatomy" of a Sequence Alignment residues residues WKKLGSNVG 1:1 residue correspondences/relationships sequences WGKVKNVD • 1:1 residue correspondences/relationships • Correspondences between • a single residue in one sequence and • a single residue in another sequence
Could perhaps say there is a "1:2" relationship between this residue and these residues "Anatomy" of a Sequence Alignment Residue has no equivalent in the top sequence i.e. no residue in the top sequence has a 1:1 relationship with this residue WKKLGSNVG 1:1 residue correspondences/relationships WGKVKNVD However, alignments focus on 1:1 relationships
Sequence Alignment Within a Grid - - - One sequence per row Residues in the same column are 'equivalent' Gap characters (usually "-") indicate that the sequence contains no residues 'equivalent' to other residues in that column WKKLGSNVG WGKVKNVD Often represented using a grid/matrix:
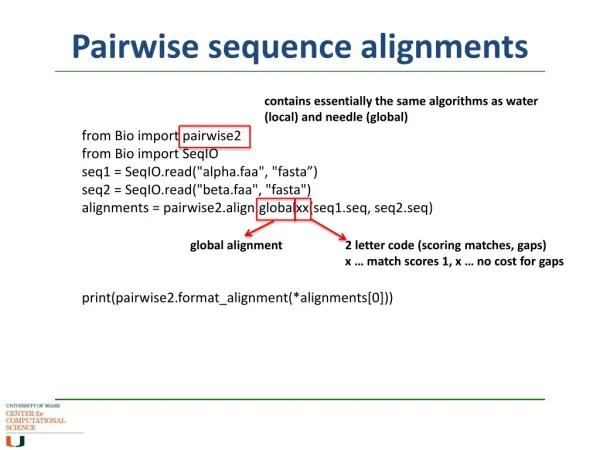
Pairwise Sequence Alignment • Raise your hands: • Who has ever seen a "pairwise alignment" before? • Who has ever used/encountered one in their research? Pairwise sequence alignments are a crucial component of many bioinformatic analyses and tools In particular they lie at the heart of the tools most commonly used to predict function of protein/DNA/RNA molecules i.e. to generate hypotheses for the function of key biological entities that can be tested by wet-lab experiments
How They Used to Align Sequences... Courtesy of Geoff Barton, Dundee
Pairwise Alignments How we can build them today "by hand" using JalView Why it's useful to look at this, despite the many automatic methods Sometimes we're right and the automatic methods are wrong and we can spot this Useful to get you thinking about how we choose a good from a bad alingment, and to identify sequences that are easier of more difficult to align (as these are the same kinds of sequences that automatic tools find easy/difficult to align, so we know better what to expect from such tools
Pairwise Alignments How we can build them today "by hand" using JalView http://tinyurl.com/protBioinf2011 • During exercises, write down: • Features that describe a relatively "good" alignment, thinking in terms of • sizes of gaps • numbers of gaps • properties of residues in the same column (the same as each other? different?) • Instructions on how to change a "bad" alignment into a better one • Characteristics of sequences that are more difficult/take more time to align than others Describe what you've written to your neighbour - have you come up with the same answers?
Pairwise Alignments • Features that describe a relatively "good" alignment: • small, few gaps • residues in the same column either the same amino acid, or ones with similar physical/chemical property • We build a "good" alignment by inserting as few, as short as possible gaps into the alignment, so that as many columns as possible contain the same/similar residues • Sequences that are more difficult/take more time to align than others when: • They are more divergent (e.g. when the best alignment contains fewer "identical" residues) • They are longer • They have very different lengths • They are DNA rather than the corresponding coding sequences • They contain "repeated" regions Part of the reason why these situations cause problems is that, rather than there clearly being one best alignment, we find several that are "equally" good (or bad)
1:1 Relationships Between Residues in the Same Column Thinking in terms of (i) protein structure and (ii) evolution, what defines the relationship that you expect residues in the same column of a good/correct alignment to share with each other? Think about this on your own for a minute. Perhaps there's just a single word you might want to use to describe this sought-after relationship? Try and write down a definition of this relationship Try and explain your answers to your neighbours
Alternative Interpretations of MSAs (Evolutionary and Structural)
“Equivalence”/similarity of residues • Structurally equivalent/similar • Evolutionary equivalent/related/homologous Residues in the same column either: Different applications assume different types of equivalence Different types of similarity not necessarily equivalent
Structural Similarity Bacterial toxins 1ji6 and 1i5p Unaligned Structurally Aligned
Structural Similarity Chain1: 68 ELIGLQANIREFNQQVDNF 1111111111111111111 Chain2: 70 ELQGLQNNFEDYVNALNSW Residues with a similar structural context may lie almost on top of each other within a structural alignment. Clearly, the dark green and red side chains have more similar structural contexts than they do with the adjacent light-coloured side chains
Chain 1: 16 KVGSLIGKR---ILSELWGIIFPSGST 111111111 11111111111 111 Chain 2: 16 VVGVPFAGALTSFYQSFLNTIWP-SDA Structural Similarity
Structural equivalence 1i5p: DNFLNPTQN----PVPLSITSSVN 111111 111111111111ji6: NSWKKTPLSLRSKRSQDRIRELFS Some regions of the structures do not have structurally equivalent residues in the other structure Alignment gaps are a sure sign of such residues Placing such residues in the same column as residues from other sequences is a misalignment - to be avoided!
“Evolutionary Equivalence” Mutation / Substitution Y-W AGWWTI AGWWTI AGWWTI AGWYTI AGWYTI AGWYTI AAWYTI AGWYTI AAQQQWYTI Substitution G-A QQQ Insertion Two copies of gene generated AG---WWTI AGWWTI AGWWTI AGWYTI AGWYTI AGWYTI AGWYTI AAWYTI AAQQQWYTI Residues in the same alignment column should trace their history back to the same residue in the ancestral sequence with any changes due only to point substitutions
Quiz - Evolutionary Interpretation of Alignments Z X Y KGE--------PGIGL------PG KGEPG------IGL------PG KGEPG---IGLPG KGIPG-----------DPAFGDPG KGIPG---------DPAFGDPG KGIPGDPAFGDPG RGIPGEVLGAQ-----------PG RGIPGEVLGAQ---------PG RGIPGEVLGAQPG Which alignment of the final sequences (X, Y or Z) only places residues in the same column if they are related by substitution events?
Quiz - Evolutionary Interpretation of Alignments "True" alignment given history described above PRANK KGE--------PGIGL------PG RGIPGEVLGAQPG KGIPG-----------DPAFGDPG KGIPGDPAFGDPG RGIPGEVLGAQ-----------PG ---KGEPGIGLPG
Quiz - Evolutionary Interpretation of Alignments MAFFT PRANK Z X CLUSTALX Y KGEPG---IGLPG KGEPG------IGL------PG KGE--------PGIGL------PG RGIPGEVLGAQPG KGEPG---IGLPG K---GEPGIGLPG KGIPG-----------DPAFGDPG KGIPGDPAFGDPG KGIPGDPAFGDPG KGIPGDPAFGDPG KGIPGDPAFGDPG KGIPG---------DPAFGDPG RGIPGEVLGAQPG RGIPGEVLGAQPG RGIPGEVLGAQ---------PG ---KGEPGIGLPG RGIPGEVLGAQPG RGIPGEVLGAQ-----------PG Different automatic MSA software gives different results All are different from the "true" alignment (assuming the scenario of transformation on the previous slide is true)... ... because that scenario is very unlikely under the models of evolutionary transformation incorporated within these tools
Interpreting Alignments • Special 1:1 relationship between residues in the same column • Structural: very similar structural context • Evolutionary: any difference between residues in the same column due to point substitution (not to any other kind of mutation e.g. deletion followed by insertion) • Structural and Evolutionary equivalence need not necessarily be the same • Not all residues have 1:1 equivalents in other sequences
Non-Equivalence of Evolutionary and Structural Alignments • Demonstration 1: • Structural equivalence without evolutionary equivalence • Structural alignment of SH3-interaction motifs from nef and ncf1 aligned ncf1/nef1 SH3 interaction motifs nef1/fyn1 PDB:1efn ncf1/ncf4 PDB:1w70
Non-Equivalence of Evolutionary and Structural Alignments Demonstration 2b: Sequences differ by ONE amino acid residue and have different folds GA95 GB95 Proc Natl Acad Sci U S A. 2009 Dec 15;106(50):21149-54. A minimal sequence code for switching protein structure and function.Alexander PA, He Y, Chen Y, Orban J, Bryan PN.PMID: 19923431
Quiz - Numbers of Insertions The minimum number of insertion events required to account for the section of haemoglobin alignment shown above is? (a) 2 (b) 1 (c) 0 (d) 3
Quiz - Numbers of Insertions The minimum number of insertion events required to account for the section of haemoglobin alignment shown above is? If all sequences are the same length, we can explain their diversity without inferring ANY insertions or deletions If and alignment contains sequences that are all either length x or y, then we can explain their diversity by inferring just one insertion or deletion
Quiz - Numbers of Insertions The minimum number of insertion events required to account for the section of haemoglobin alignment shown above is? • We can ALWAYS explain observed sequence length diversity with: • 0 insertions (all length variation due to deletion) • 0 deletions (all length variation due to insertion) • a combination of insertions and deletions Perhaps we should instead focus on inferring the most likely scenario? (Although if this is not particularly relevant for our analysis, perhaps we should focus instead on something completely different!)
Distinguishing Better from Worse Alignments An "objective" way of choosing which of two alignments (between the same pair of sequences) is "better" (more likely to be correct) would help us identify "good" alignments Scoring schemes/rules have been developed for this purpose These aim to assign higher scores to alignments that are more similar to true alignments NOTE - we are optimising against some "average" protein - thse may be different for different proteins, howver it's still demonstrably useful higher score the more similar an alignment is to that are more similar to "true" alignments should get a higher score than those similar means - more columns in which residues are found int eh asme column as each other in true alignments, more gaps of similar size and number as in true alignments lower score
Scoring Schemes for Aligned Residues Commonly, scoring schemes (for columns containing no gaps) assign a score for each column... ...the score for the full alignment is then the sum of the individual column scores Below we calculate, in this way, a score for two alignments of the same sequences For each column, the score assigned depends on which residues are found in the column Aligned residue scores are taken from an amino acid substitution matrix - see next slide... score = 3.8 + 0.5 = 4.3 3.8 0.5 score = 3.8 + 0.4 = 4.2 3.8 0.4
Amino Acid Substitution Matrices Matrix provides a score for alignment of each different pair of amino acids score = 3.8 + 0.5 = 4.3 3.8 0.5 Gonnet PAM250 score = 3.8 + 0.4 = 4.2 3.8 0.4
Amino Acid Substitution Matrices Values in some cells in this matrix are positive Although more cells contain negative values Gonnet PAM250
Amino Acid Substitution Matrices • Values are obtained analysing alignments between sequences that we are very confident: • have similar 3D structures • evolutionarily related by processes of: • point substitution • insertion • deletion Gonnet PAM250
Amino Acid Substitution Matrices count how often we see each pair of residues in the same column count how often each different aa is found in the datasets Block IPB000108A ID P67PHOX; BLOCK AC IPB000108A; distance from previous block=(7,386) DE Neutrophil cytosol factor 2 signature BL PR00499; width=18; seqs=27; 99.5%=1042; strength=1146 NCF2_BOVIN|O77775 ( 218) APLQPQAAEPPPRPKTPE 9 NCF2_HUMAN|P19878 ( 218) APLQPQAAEPPPRPKTPE 9 O70145|O70145_MOUSE ( 218) APLQPQSAEPPPRPKTPE 10 YKA7_CAEEL|P34258 ( 117) IPLKEAFTALPPRPAAPS 40 Q8NFC7 ( 218) APLQPQAAEPPPRPKTPE 9 Q9BV51 ( 218) APLQPQAAEPPPRPKTPE 9 Q95MN2|Q95MN2_RABIT ( 218) APLQPQAAEPPPRPKTPE 9 Q95L70|Q95L70_BISBI ( 218) APLQPQAAEPPPRPKTPE 9 Q9N0E9|Q9N0E9_TURTR ( 218) APLQPQAAEPPPRPKTPE 9 Q6GMC8|Q6GMC8_XENLA ( 219) APLQPQANNPPSRPKTPE 22 Q59F14|Q59F14_HUMAN ( 246) APLQPQVRQSDLLGAQAG 95 Q61QT5|Q61QT5_CAEBR ( 237) IPLKEAFSAPPPRPAAPS 37 Q5R5J0|Q5R5J0_PONPY ( 218) APLQPQAAEPPPRPKTPE 9 O08635|O08635_MOUSE ( 20) QIFKNQDPVLPPRPKPGH 20 Q3TC92|Q3TC92_MOUSE ( 232) APLQPQSAEPPPRPKTPE 10 Q3U5S4|Q3U5S4_MOUSE ( 218) APLQPQSAEPPPRPKTPE 10 Q6DFH8|Q6DFH8_XENLA ( 52) YVIKRQQPDLPPRPKPGH 43 Q499C5|Q499C5_XENTR ( 219) APLQPQASNPPPRPKTPE 13 Q60FB5|Q60FB5_ONCMY ( 218) APLQPQVEEVPTRPKVPE 25 Q32N10|Q32N10_HUMAN ( 387) QVFKNQDPVLPPRPKPGH 16 Q5HYK7|Q5HYK7_HUMAN ( 387) QVFKNQDPVLPPRPKPGH 16 Q5U3B8|Q5U3B8_HUMAN ( 20) QVFKNQDPVLPPRPKPGH 16 Q9UFC8|Q9UFC8_HUMAN ( 8) QVFKNQDPVLPPRPKPGH 16 Q4R8R2|Q4R8R2_MACFA ( 20) QVFKNQDPVLPPRPKPGH 16 O35146|O35146_MOUSE ( 10) KIVTPLDERPRGRPNDSG 100 Q1PCS1|Q1PCS1_MUSMM ( 218) APLQPQSAEPPPRPKTPE 10 Q1A3S2|Q1A3S2_9PERO ( 218) APLQPQVEDGPTRPKEPE 27 // One set of matrices (the BLOSUM series) are built by analysing many ungapped regions ("blocks") of alignments of fairly similar sequences calculate which is more likely: residues are found in the same column by chance residues are found in the same column in alignments analysed numbers range between 0 and infinity < 1 - more likely by chance > 1 more likely that it's beca • Values are obtained analysing alignments between sequences that we are very confident: • have similar 3D structures • evolutionarily related by processes of: • point substitution • insertion • deletion http://blocks.fhcrc.org/blocks-bin/getblock.pl#IPB000108A
Amino Acid Substitution Matrices count how often we see each pair of residues in the same column count how often each different aa is found in the datasets • Key parameters estimated in analysis: • frequency (qij) with which residues i and j are found in the same column (averaged over all analysed blocks) • frequency with which each pair of residues are found in same column if all sequences randomised • where pi is the frequency with which residue i is present in the complete dataset, this is: pi * pj Block IPB000108A ID P67PHOX; BLOCK AC IPB000108A; distance from previous block=(7,386) DE Neutrophil cytosol factor 2 signature BL PR00499; width=18; seqs=27; 99.5%=1042; strength=1146 NCF2_BOVIN|O77775 ( 218) APLQPQAAEPPPRPKTPE 9 NCF2_HUMAN|P19878 ( 218) APLQPQAAEPPPRPKTPE 9 O70145|O70145_MOUSE ( 218) APLQPQSAEPPPRPKTPE 10 YKA7_CAEEL|P34258 ( 117) IPLKEAFTALPPRPAAPS 40 Q8NFC7 ( 218) APLQPQAAEPPPRPKTPE 9 Q9BV51 ( 218) APLQPQAAEPPPRPKTPE 9 Q95MN2|Q95MN2_RABIT ( 218) APLQPQAAEPPPRPKTPE 9 Q95L70|Q95L70_BISBI ( 218) APLQPQAAEPPPRPKTPE 9 Q9N0E9|Q9N0E9_TURTR ( 218) APLQPQAAEPPPRPKTPE 9 Q6GMC8|Q6GMC8_XENLA ( 219) APLQPQANNPPSRPKTPE 22 Q59F14|Q59F14_HUMAN ( 246) APLQPQVRQSDLLGAQAG 95 Q61QT5|Q61QT5_CAEBR ( 237) IPLKEAFSAPPPRPAAPS 37 Q5R5J0|Q5R5J0_PONPY ( 218) APLQPQAAEPPPRPKTPE 9 O08635|O08635_MOUSE ( 20) QIFKNQDPVLPPRPKPGH 20 Q3TC92|Q3TC92_MOUSE ( 232) APLQPQSAEPPPRPKTPE 10 Q3U5S4|Q3U5S4_MOUSE ( 218) APLQPQSAEPPPRPKTPE 10 Q6DFH8|Q6DFH8_XENLA ( 52) YVIKRQQPDLPPRPKPGH 43 Q499C5|Q499C5_XENTR ( 219) APLQPQASNPPPRPKTPE 13 Q60FB5|Q60FB5_ONCMY ( 218) APLQPQVEEVPTRPKVPE 25 Q32N10|Q32N10_HUMAN ( 387) QVFKNQDPVLPPRPKPGH 16 Q5HYK7|Q5HYK7_HUMAN ( 387) QVFKNQDPVLPPRPKPGH 16 Q5U3B8|Q5U3B8_HUMAN ( 20) QVFKNQDPVLPPRPKPGH 16 Q9UFC8|Q9UFC8_HUMAN ( 8) QVFKNQDPVLPPRPKPGH 16 Q4R8R2|Q4R8R2_MACFA ( 20) QVFKNQDPVLPPRPKPGH 16 O35146|O35146_MOUSE ( 10) KIVTPLDERPRGRPNDSG 100 Q1PCS1|Q1PCS1_MUSMM ( 218) APLQPQSAEPPPRPKTPE 10 Q1A3S2|Q1A3S2_9PERO ( 218) APLQPQVEDGPTRPKEPE 27 // calculate which is more likely: residues are found in the same column by chance residues are found in the same column in alignments analysed numbers range between 0 and infinity < 1 - more likely by chance > 1 more likely that it's beca If two residues i and j are more often found in the same column in blocks compared to randomised sequences then qij / pi*pj > 1 and log(qij / pi*pj) > 0 http://blocks.fhcrc.org/blocks-bin/getblock.pl#IPB000108A
Amino Acid Substitution Matrices count how often we see each pair of residues in the same column count how often each different aa is found in the datasets • Key parameters estimated in analysis: • frequency (qij) with which residues i and j are found in the same column (averaged over all analysed blocks) • frequency with which each pair of residues are found in same column if all sequences randomised • where pi is the frequency with which residue i is present in the complete dataset, this is: pi * pj Block IPB000108A ID P67PHOX; BLOCK AC IPB000108A; distance from previous block=(7,386) DE Neutrophil cytosol factor 2 signature BL PR00499; width=18; seqs=27; 99.5%=1042; strength=1146 NCF2_BOVIN|O77775 ( 218) APLQPQAAEPPPRPKTPE 9 NCF2_HUMAN|P19878 ( 218) APLQPQAAEPPPRPKTPE 9 O70145|O70145_MOUSE ( 218) APLQPQSAEPPPRPKTPE 10 YKA7_CAEEL|P34258 ( 117) IPLKEAFTALPPRPAAPS 40 Q8NFC7 ( 218) APLQPQAAEPPPRPKTPE 9 Q9BV51 ( 218) APLQPQAAEPPPRPKTPE 9 Q95MN2|Q95MN2_RABIT ( 218) APLQPQAAEPPPRPKTPE 9 Q95L70|Q95L70_BISBI ( 218) APLQPQAAEPPPRPKTPE 9 Q9N0E9|Q9N0E9_TURTR ( 218) APLQPQAAEPPPRPKTPE 9 Q6GMC8|Q6GMC8_XENLA ( 219) APLQPQANNPPSRPKTPE 22 Q59F14|Q59F14_HUMAN ( 246) APLQPQVRQSDLLGAQAG 95 Q61QT5|Q61QT5_CAEBR ( 237) IPLKEAFSAPPPRPAAPS 37 Q5R5J0|Q5R5J0_PONPY ( 218) APLQPQAAEPPPRPKTPE 9 O08635|O08635_MOUSE ( 20) QIFKNQDPVLPPRPKPGH 20 Q3TC92|Q3TC92_MOUSE ( 232) APLQPQSAEPPPRPKTPE 10 Q3U5S4|Q3U5S4_MOUSE ( 218) APLQPQSAEPPPRPKTPE 10 Q6DFH8|Q6DFH8_XENLA ( 52) YVIKRQQPDLPPRPKPGH 43 Q499C5|Q499C5_XENTR ( 219) APLQPQASNPPPRPKTPE 13 Q60FB5|Q60FB5_ONCMY ( 218) APLQPQVEEVPTRPKVPE 25 Q32N10|Q32N10_HUMAN ( 387) QVFKNQDPVLPPRPKPGH 16 Q5HYK7|Q5HYK7_HUMAN ( 387) QVFKNQDPVLPPRPKPGH 16 Q5U3B8|Q5U3B8_HUMAN ( 20) QVFKNQDPVLPPRPKPGH 16 Q9UFC8|Q9UFC8_HUMAN ( 8) QVFKNQDPVLPPRPKPGH 16 Q4R8R2|Q4R8R2_MACFA ( 20) QVFKNQDPVLPPRPKPGH 16 O35146|O35146_MOUSE ( 10) KIVTPLDERPRGRPNDSG 100 Q1PCS1|Q1PCS1_MUSMM ( 218) APLQPQSAEPPPRPKTPE 10 Q1A3S2|Q1A3S2_9PERO ( 218) APLQPQVEDGPTRPKEPE 27 // calculate which is more likely: residues are found in the same column by chance residues are found in the same column in alignments analysed numbers range between 0 and infinity < 1 - more likely by chance > 1 more likely that it's beca If two residues i and j are less often found in the same column in blocks compared to randomised sequences then qij / pi*pj < 1 and log(qij / pi*pj) < 0 http://blocks.fhcrc.org/blocks-bin/getblock.pl#IPB000108A
aa Substitution Matrix Values Values in matrix cells are proportional to log(qij / pi*pj) • What range of scores would you expect alignments that are more similar to alignments found in blocks, compared to alignments between random sequences, to have: • scores < 0 • 0 < scores < 1 • 0 > scores 3.8 0.5 score = 3.8 + 0.5 = 4.3
Sequence Similarity Searching Query sequence Build optimal alignment between query sequence and each database sequence Database of sequences ... Calculate score for each optimal alignment For each alignment, calculate how many alignments between randomised (structurally dissimilar/evolutionarily unrelated) sequences you would expect with a score the same or greater than the score for this alignment This number is the E-value
Interpreting E-values E-value of 0.001 means that you would expect this score to be found for an alignment between randomised sequences once in every 1000 similar searches • For each of values below, decide whether it it impossible that it be reported as the result of such a search: • 1 • 0 • 0.00001 • 1000000000 • -1
Interpreting E-values You have carried out a BLAST search with a query sequence seqA against a database dbB, such that there are no sequences in dbB that are "related" to seqA What is the most likely E-value for the highest-scoring alignment?
Interpreting E-values You have carried out a BLAST search with a query sequence seqA against a database dbB, such that there are no sequences in dbB that are "related" to seqA • You carry out several variants of this search, as described below. For each search, decide: • the most likely value of the E-value for the highest-scoring alignment • the most likely fraction of the score of highest-scoring alignment compared to that of the initial search (5 times larger? 5 times smaller etc.) • delete the second half of seqA, search against dbB • query seqA against a database (dbC) which contains two copies of every sequence in dbB • query seqA against a database (dbD) from which every second sequence in dbB has been removed from