Download
1 / 45
450 likes | 631 Views
Verification of Rare Extreme Events. Dr. David B. Stephenson 1 , Dr Barbara Casati, Dr Clive Wilson 1 Department of Meteorology University of Reading www.met.rdg.ac.uk/cag. Definitions and questions Eskdalemuir precipitation example Results for various scores.

E N D
Verification of Rare Extreme Events Dr. David B. Stephenson1, Dr Barbara Casati, Dr Clive Wilson 1Department of Meteorology University of Reading www.met.rdg.ac.uk/cag • Definitions and questions • Eskdalemuir precipitation example • Results for various scores WMO verification workshop, Montreal, 13-17 Sep 2004
What is an extreme event? Different definitions: Maxima/minima Magnitude Rarity Severity Train crash here … Gare Montparnasse, 22 October 1895 “Man can believe the impossible, but man can never believe the improbable.” - Oscar Wilde
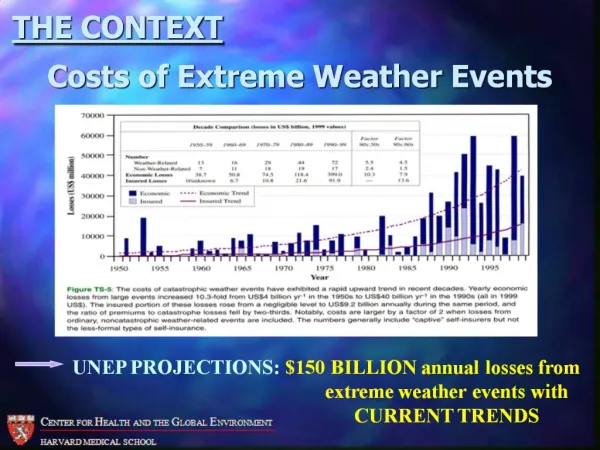
What is a severe event? Severe events (extreme loss events) caused by: • Rare weather events • Extreme weather events • Clustered weather events (e.g. climate event) Natural hazard e.g. windstorm Damage e.g. building Loss e.g. claims ($) Risk=p(loss)=p(hazard) X vulnerability X exposure “Rare and Severe Events” (RSE) – Murphy, W&F, 6, 302-307 (1991)
Sergeant John Finley’s tornado forecasts 1884 Percentage Correct=96.6%!! Gilbert (1884) F=No 98.2%!! Peirce (1884) PSS=H-F Oldest known photograph of a tornado 28 August 1884 22 miles southwest of Howard, South Dakota NOAA Historic NWS Collection www.photolib.noaa.gov
How to issue forecasts of rare events • Let {X=0/1} when the event/non-event occurs: 0 0 0 1 1 0 0 0 0 … [probability of event p=Pr(X=1) (base rate) is small ] • Ideally one should issue probability forecasts {f}: 0.1 0.2 0.3 0.6 0.5 0.1 0.3 0.4 0.6 … • Generally forecaster or decision-maker invokes a threshold to produce deterministic forecasts {Y=0/1}: 0 0 0 1 1 0 0 0 1 … A. Murphy, “Probabilities, Odds, and Forecasts of Rare Events”, Weather and Forecasting, Vol. 6, 302-307 (1991)
Some important questions … • Which scores are the best for rare event forecasts? PC, PSS, TS, ETS, HSS, OR, EDS • Can rare event scores be improved by hedging? • How much true skill is there in forecasts of extreme events? • Are extreme events easier to forecast than small magnitude events? Does skill0 as base rate0? • Others? Please let’s discuss them!
Time series of the 6 hourly rainfall totals Met Office mesoscale model forecasts of 6h ahead 6h precipitation amounts (4x times daily) Total sample size n=6226
Scatter plot of forecasts vs. observations some positive association between forecasts and observations
Empirical Cumulative Distribution F(x)=1-p can use E.D.F. to map values onto probabilities (unit margins)
Scatter plot of empirical probabilities c a d b note dependency for extreme events in top right hand corner
Joint probabilities versus base rate ------ a ------ b=c ------ d As base rate tends to 0, counts b=c>a0 and d1
2x2 binary event asymptotic model p = prob. of event being observed (base rate) B = forecast bias (B=1 for unbiased forecasts) H = hit rate 0 as p0 (regularity of ROC curve) so H~hpk as p0 (largest hit rates when k>0 is small) (random forecasts: H=Bp so h=B and k=1)
Joint probabilities vs. base rate (log scale) ------ a ------ b=c ------ d note power law behaviour of a and b=c as function of base rate
Hit rate as function of threshold ------ Met Office ------ Persistence T+6h ------ H=p random Both Met Office and persistence have more hits than random
False Alarm Rate as a function of threshold ------ Met Office ------ Persistence ------ F=p random Both forecast false alarm rates converge to F=pB as p0
ROC curve (Hit rate vs. False Alarm rate) ------ Met Office ------ Persistence ------ H=F random Asymptotic limit As (F,H)(0,0) ROC curves above H=F no-skill line and converge to (0,0)
Proportion correct • perfect skill for rare events!! • only depends on B – not on H! • pretty useless for rare event forecasts!
Proportion correct versus threshold ------ Met Office ------ Persistence ------ PC=1-2p random PC goes to 1 (perfect skill) as base rate p0
Peirce Skill Score (True Skill Statistic) • tends to zero for vanishingly rare events • equals zero for random forecasts (h=B k=1) • when k<1, PSSH and so can be increased by overforecasting (Doswell et al. 1990, W&F, 5, 576-585.)
Peirce Skill Score versus threshold ------ Met Office ------ Persistence ------ PSS=p PSS tends to zero (no-skill) as base rate p0
Threat Score (Gilbert Score) • tends to zero for vanishingly rare events • depends explicitly on the bias B (Gilbert 1884; Mason 1989; Schaefer 1990)
Threat Score versus threshold ------ Met Office ------ Persistence ------ TS=p/2 random TS tends to zero (no-skill) as base rate p0
Brief history of threat scores • Gilbert (1884) - “ratio of verification”(=TS) “ratio of success in forecasting”(=ETS) • Palmer and Allen (1949) - “threat score” TS • Donaldson et al. (1975) - “critical success index”(=TS) • Mason (1989) – base rate dependence of CSI(=TS) • Doswell et al. (1990) – HSS2TS/(1+TS) • Schaefer (1990) – GSS(ETS)=HSS/(2-HSS) • Stensrud and Wandishin (2000) – “correspondence ratio” • Threat score ignores counts of d and so is strongly dependent on the base rate. ETS tries to remedy this problem.
Equitable threat Score (Gilbert Skill Score) • tends to zero for vanishingly rare events • related to Peirce Skill Score and bias B
Equitable Threat Score vs. threshold ------ Met Office ------ Persistence ------ ETS=p ETS tends to zero as base rate p0 but not as fast as TS
Heidke Skill Score • tends to zero for vanishingly rare events • advocated by Doswell et al. 1990, W&F, 5, 576-585 • ETS is a simple function of HSS and both these are related to the PSS and the bias B.
Heidke Skill Score versus threshold ------ Met Office ------ Persistence ------ HSS=p HSS tends to zero (no-skill) as base rate p0
Odds ratio • tends to different values for different k (not just 0 or 1!) • explicitly depends on bias B
Log odds ratio versus threshold ------ Met Office ------ Persistence ------ odds=1 random Odds ratio for these forecasts increases as base rate p0
Logistic ROC plot ------ Met Office ------ Persistence ------ H=F random Linear behaviour on logistic axes – power law behaviour
Extreme Dependency Score S. Coles et al. (1999) Dependence measures for Extreme Value Analyses, Extremes, 2:4, 339-365. • does not tend to zero for vanishingly rare events • not explicitly dependent on bias B • measure of the dependency exponent: k=(1-EDS)/(1+EDS)
Extreme Dependency Score vs. threshold ------ Met Office ------ Persistence ------ EDS=0 random EDS=0.6 k=1/4 EDS=0.4 k=3/7 strikingly constant non-zero dependency as p0
Hedging by random underforecasting Underforecasting by random reassignment causes scores to: • Increase – proportion correct (see Gilbert 1884) • No change – odds ratio, extreme dependency score • Decrease – all other scores that have been shown
Hedging by random overforecasting Overforecasting by random reassignment causes scores to: • Increase – Hit Rate, False Alarm Rate • No change – odds ratio, extreme dependency score • Decreased magnitude – PC, PSS, HSS, ETS • Other: TS? Compare with C. Marzban (1998), W&F, 13, 753-763.
Conclusions • Which scores are the best for rare event forecasts? EDS, Odds ratio, … (PSS,HSS,ETS0!) • Can rare event scores be improved by hedging? Yes (so be very careful when using them!) • How much true skill is there in forecasts of extreme events? Quite a bit! • Are extreme events easier to forecast than small magnitude events? skill0? Perhaps yes – there is extreme dependency
Some future directions • Methods to infer rare event probability forecasts from ensemble forecasts • Methods to verify probabilistic rare event forecasts (not just Brier score!) • Methods for pooling rare events to improve verification statistics • Other?
2x2 table for random binary forecasts • p = prob. of event being observed (base rate) • B = forecast bias (B=1 for unbiased forecasts) • H=Bp=F (h=B and k=1)
Summary • Proportion Correct and Heidke Skill Score tend to 1 for vanishingly rare events • Peirce Skill Score, Threat Score and Equitable Threat Score all tend to 0 for vanishingly rare events • All these scores can be improved by underforecasting the event (reducing B) • There is redundancy in the scores: HSS~PC and ETS~PSS/(1+B) • The odds ratio and Extreme Dependency Score give useful information on extreme dependency of forecasts and observations for vanishingly rare events
Plan • Definition of an extreme event forecast Binary rare deterministic (o,p) obtainable from (x,y) Or (x,F(x)) by thresholding rx,ry or rx. 2. The Finley example and some rare event scores 3. The Eskdalemuir example – problem with scores Some suggestions for future scores? Extremes=low skill noise OR causal events?
Verification methods for rare event literature • Gilbert (1884) • Murphy (19??) • Schaeffer (19??) • Doswell et al. (19??) • Marzban (19??) • … a few others (but not many!)
Types of forecast O=observed value (predictand) F=predicted value (predictor) Types of predictand: • Binary events (e.g. wet/dry, yes/no) • Multi-categorical events (>2 categories) • Continuous real numbers • Spatial fields etc. Types of predictor: • F is a single value for O (deterministic/point forecast) • F is a range of values for O (interval forecast) • F is a probability distribution for O (probabilistic forecast)
Peirce Skill Score versus threshold ------ Met Office ------ Persistence ------ PC=1-p random PSS tends to zero (no-skill) as base rate p0