Download
1 / 32
320 likes | 492 Views
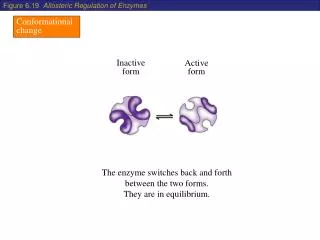
Conformational Flexibility and Ligand Design. Dr. Eamonn F. Healy Professor of Chemistry St. Edward’s University, Austin, Tx.

E N D
Conformational Flexibility and Ligand Design Dr. Eamonn F. Healy Professor of Chemistry St. Edward’s University, Austin, Tx. Our research focuses on the design of structure-activity probes to elucidate enzymatic activity. The interdisciplinary approach includes molecular modeling for the simulation of inhibitor binding , overexpression of wild-type and mutant target proteins and in vitro assays of enzymatic activity and inhibition. Our targets include HIV-1 integrase, the c-Kit and src-abl proteins , and the metalloproteinases associated with CXCL16 shedding. Large flexible ligands and conformationally mobile proteins present two distinct, but related challenges. Lessons learned from investigating these target systems will be presented.
A process for drug design which bases the design of the drug upon the structure of its protein target. Structural mapping of the receptor (protein, P) active site Identification of ligands (L) of complementary shape and appropriate functionality Docking of the ligand to the receptor site - predicting a range of PL complexes with different DGPL values 4. Scoring i.e. ranking DGPL and correlating with experimentally determined properties such as IC50 values
PROTEIN Structural mapping of the receptor active site • Crystal structure available for Integrase but : I. Limitations of crystal structure: • Often only one domain • Membrane or DNA attachment sites usually not shown • Crystal structure vs. physiologically active structure II. Position of hydrogens undetermined III. Residues missing or ill-defined IV. Protonation of His undetermined V. Solvation VI.Conformational Dynamics
LIGAND Identification of ligands (L) of complementary shape and appropriate functionality Crystal structure often available for Inhibitor bound to catalytic core but : I. Position of hydrogens undetermined II. Tautomeric structures possible III. Influence of pH IV. Need to limit conformational flexibility based on experimental and theoretical crteria Fixed and planar Based on HF/6-31G* calculations Limited to +/- 45 degrees
DOCKING Docking of the ligand to the receptor site - predicting a range of PL complexes with different DGPL values The prediction of the ligand conformation and orientation within a targeted binding site involves: I. Positioning ligand and evaluating quality of binding II. Refining ligand position III. Energy minimization (electrostatic, steric, strain and h-bond)
SCORING 4. Scoring i.e. ranking DGPL and correlating with experimentally determined properties such as IC50 values The prediction of the optimum ligand conformation and orientation within a targeted binding site involves: I. Posing : Determining the fit of the ligand II. Conformational Searching III. Scoring and Ranking
(A) 6.7 degree tilt on the N-lobe towards the C-lobe for the conversion of inactive c-Kit (yellow) to the active form (blue) ; (B) The induced fit of imanitib mesylate to c-Kit, shown as a superimposition of the inactive form in the absence of inhibitor (yellow) and c-Kit+inhibitor ( gray); (C), (D) Key structural elements of inactive (C) and active (D) conformations B A D C FEBS Lett.2009, 583, 2899-2906.
Surface representation showing Ile653 side chain in red. Electrostatic map of bound inhibitor
Solvent accessible surfaces for Ile653 side chain + Aryl ring of inhibitor.
Trajectory analysis for solvent-exposed intra-helix backbone hydrogen bond distance between Leu644 and Gly648 of the C-helix for a 1 ns molecular dynamics run for c-Kit with ( )nd without ( )bound ligand .
Final conformation for the 1ns MD run for c-Kit with bound ligand. Final conformation for the 1ns MD run for c-Kit without bound ligand.
(A) Inhibition of c-Kit through the binding of 9-hydroxy ellipticine. (B) Inhibition of c-Abl through the binding of 9-hydroxy ellipticine. (C) Docked structures for 9-hydroxy ellipticene in blue,9-methoxyellipticine in green and ADP in gray with 1OPK. (D) Postion of the 9-methoxyellipticine ligand in relation to the backbone hydrogen bond between Phe401 and Leu403. A B C D
Repositioning of DFG motif through movement of activation loop in going from inactive (yellow) to active (blue) c-Kit
Dominant Patterns of Drug Resistance for certain Tyrosine Kinases
HIV-1 Integrase Inhibitors DKAs DCQ acids; DCT acids PDP SQL Quinolone derived
L-Chicoric Acid and HIV-1 Integrase J Mol. Graph. Model. 2009, 27 , 14.
Conformer energies, and predicted conformer populations, for the various L-CA conformer geometries. Results of 100 independent docking runs for the ligands L-CA and its tetraacetylated derivative with proteins 1QS4 and the mutant Q148A.
Top-ranked binding modes for s-cis /s-cis L-CA (top left), s-cis /s-trans L-CA (top right), tetracetylated derivative of L-CA (bottom left) and a surface image of the inhibitor binding pocket with bounds-cis /s-cis L-CA overlaid with the experimentally observed 5CITEP inhibitor (bottom right).
Hydrogen bonded interactions and electrostatic map for the top-ranked s-cis /s-cis L-CA solution
ADAM Ligand Design Major determinant of potency and selectivity. Long chains can provide selectivity. Wide range of substituents tolerated. Charged polar groups influence bilary excretion. A zinc-binding group provides high affinity but low selectivity Wide range of substituents tolerated and are determinants of potency. Steric bulk beneficial for oral availability.
Acetylenic Sufonamide Inhibitor Design S1’-S3’ Channel
Future Ligand Design S1 S2
Future Ligand Design: Electrostatic map of S2 binding pocket
Protein Alignment for ADAM17 and ADAM10 S1 S1’ S3’ S2 S2’ loop