Download
1 / 28
280 likes | 434 Views
Potential Consequences Of Selection On Gestation Length On Holstein Performance. Introduction. Genetic evaluations for gestation length (GL) were recently calculated (Norman et. al., 2009) Although GL can be changed genetically, the preferred direction is not clear

E N D
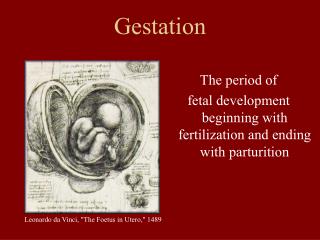
Potential Consequences Of Selection On Gestation Length On Holstein Performance
Introduction • Genetic evaluations for gestation length (GL) were recently calculated (Norman et. al., 2009) • Although GL can be changed genetically, the preferred direction is not clear • Selection for GL could have indirect economic effects through correlations with cow or calf health and longevity
Objectives • Determine if genetic evaluations of GL were accurate and repeatable • To assess the consequences of changing GL on subsequent milk and fitness traits
Data and methods • Predictor data: • PTA GL derived from calvings between Jan. 1998 and Dec. 2005 • Stratify 1,620 Holstein bulls with at least 300 breedings into 7 groups (≤-3.01, -3.00 to -2.01, … 1.00 to 1.99, and ≥2.00) according to PTA GL • Predictee data: • Phenotypic data of 261,598 Holstein first parity cows calving 2006 - 2009 mated to same bulls
Model to examine effectiveness of PTA GL Phenotypic trait= Herd-yr of conception + Service sire PTA GL group + Cow conception day + Cow conception day squared + Error
GL (d) Milk (kg) Fat (kg) Protein (kg) SCS Calving Ease score Stillbirth (%) Days Open Culled (%) Productive Life (mo) Traits predicted:
What / when traits were measured Productive Life Culled Gestation length Days open Cow’s 1st calving Cow’s 2nd calving Cow’s 3rd calving CE, SB Milk, fat, protein, SCS
Least squares means of prediction of mate GL from service sire PTA GL b = 1.01 ± 0.02
Least squares means of prediction of 2nd parity ME Protein from service sire GL group
Least squares means of prediction of 2nd parity stillbirth (%) from service sire GL group
Least squares means of prediction of 2nd parity days open from service sire GL group
Least squares means of prediction of Productive life from service sire GL group
Model to examine GL effect on subsequent lactation (phenotypic) Phenotypic trait= Herd-yr of conception + Cow 1st parity gestation length group + Cow conception day + Cow conception day squared + Error
Least squares means of 2nd parity ME Protein (kg) by cow 1st parity GL group
Least squares means of 2nd parity stillbirth (%) by cow 1st parity GL group Twins removed
Least squares means of 2nd parity days open by cow 1st parity GL group
Least squares means of Productive life by cow 1st parity GL group
Model to examine relationship of dam’s GL on daughter lactation Daughter phenotypic trait= Herd-yr dam conception–yr of daughter conception + Dam gestation length group + Dam age at conception (linear) + Cow conception day + Cow conception day squared + Error
Daughter’s traits predicted Productive Life Culled Days open Gestation length Cow’s 1st calving Cow’s 2nd calving Milk, fat, protein, SCS CE, SB
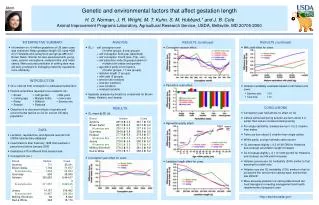
Least squares means for daughter 1st parity production traits
Conclusions • Gestation length can be changed through choice of service sire • Relationship between GL and subsequent performance was small • Little evidence found that shortening or increasing GL would provide an advantage overall • Little influence from dam’s GL evident across generations