Download

1 / 29
290 likes | 466 Views
Snapshot of the Chilean Economy. Source : Central Bank of Chile. Chilean Economic Activity.

E N D
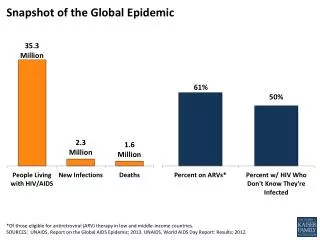
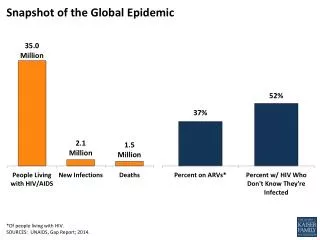
Snapshot of the Chilean Economy Source: Central Bank of Chile
Chilean Economic Activity IMACEC Index, which tracks the Chilean economic activity in a monthly basis, has consistently reached levels above 5% during the past few years. Also, it highlights the 2010 earthquake’s impact on the economy. Source: Central Bank of Chile
Economic Growth Projections Growthcomparison: World, LatinAmerica and OECD 2000-2013 *Projected growth Source: International Monetary Fund
Outstanding Business Environment Doing Business 2012 CompetitivenessYearbook 2012 EconomicFreedomIndex 2012 (7 out of 179 economies)* (39 out of 183 economies)* Chile leads Latin America. *Selected economies.
Chile, un país abierto al mundo Globally integrated economy • A country with an open economy: 22 Free Trade Agreements with 59 countries. • Turkey • Ecuador • Colombia • Australia • Peru • Cuba • Panama • Japan • India • P-4 • China • EFTA • Korea • United States • European Union • Central America • Mexico • Canada • MERCOSUR • Venezuela • Bolivia • Malaysia • Thailand • Hong Kong • Nicaragua • Vietnam Agreements In force Agreements signed but not yet in force Agreements under negotiation 63% of world population 90.5% of Chile´s export markets 86% of the global GDP Source: Government of Chile| Foreign Investment Committee
Avoidance of Double Taxation Agreements (ADTA) • Chile has entered into 25 ADTA with 25 countries. • Thailand • Malaysia • New Zealand • UnitedStates • Russia • Australia • Belgium • Denmark • Spain • France • Ireland • Poland • Portugal • United Kingdom • Sweden • Switzerland • Norway • Croatia • Canada • Colombia • Ecuador • Mexico • Peru • Argentina • Brazil • Paraguay • South Korea Agreements in force Agreements signed but not yet in force Agreements under negotiation Source: Government of Chile, Foreign Investment Committee
FDI in Top 10 Host Economies Top 10 host economies (FDI inflows, average 2009-2011, US$ Billions)
FDI in Emerging Markets The FDI historical flows exhibit imbalances among the 3 main emerging markets worlwide: Em. Asia, Em. Europe and LatAm. However, we observe a positive trend towards Latin America in the past year, which is estimated to increase this year. Source: Central Bank of Chile
FDI Flows into Latin America and the Caribbean • Chile became Latin America’s second largest recipient of FDI in 2012. United Nations forecasted a US$26.400 million FDI inflow to Chile last year, however this was topped by the actual figure of US$28.152 million. Latin America’s Largest FDI recipients 2011-2012* (ThUS$ million) Forecast Growth Rate of FDI inflows by Region, 2012 (%) * 2012 figures are estimates. Source: Global Investment Trends Monitor, UNCTAD. • While Latin America and the Caribbean would register an average growth of 7,2%, FDI flows worldwide would score US$1,3 billion, with a 18,3% decrease over the previous year. This figure, close to the 2009 figure, would be influenced by low FDI inflows to Europe and the U.S., mainly due to the uncertainty in macroeconomic policies for investors. Source: Global Investment Trends Monitor, UNCTAD.
FDI in Chile Figures provided by the Central Bank of Chile exhibit a record level of FDI in 2012, reaching US$28.152 million, a 62,7% increase from previous record in 2011. This implies a 27,1% CAGR between 2002 and 2012, placing 2012’s FDI as 11 times the 2002 level. Source: Central Bank of Chile
FDI in Chile, inflows under D.L. 600 1974-2011 (US$82,021 million) Breakdown by countries Breakdown by industries Source: Foreign Investment Committee
Canadian FDI in Chile Canada has been the main source of Foreign Direct Investment in Chile for the past decade, accounting for 24% of total FDI in that period (MMUS$ 7.799), according to the Foreign Investment Committee. Source: Foreign InvestmentCommittee Source: ForeignInvestmentCommitee Source: ForeignInvestmentCommitee Since 1974, when FDI measure was first implemented in Chile, Canada has been the third largest foreign investor in the country, accounting for 18% of total inflows (MMUS$ 14.822). Source: ForeignInvestmentCommitee
Investment Opportunities • Mining • Food Industry • Chile is a world class player. • Mining companies plan to invest US$91 billion during the next eight years. • Investment Opportunities: • Produce Industry; • Wine Industry and grape sub-products; • Olive Industry; • Meat and Dairy sub-products; • Salmon Industry; • Food Ancillary Industries; • Elaborated Foods; • Biotechnology applied to the Food Industry. • Infrastructure • Energy • Chile has an investment portfolio of an aggregate amount of US$7,9 billion in public tenders. • High growth potential. • Investment Opportunities: • Natural conditions for Non-Conventional Renewable Energy; • Need for matrix diversification; • Energy independence. • Manufacturing & Assembly • Services In 2010, service exports totaled US$10.8 billion. 15% of our total exports and 5% of GDP. • Export-oriented fabrication & integration of parts & • components. Source: Government of Chile, Foreign Investment Committee
International Trade: Chile - Canada There are 2 main sources to measure international trade between Chile and Canada: StatsCan and the Central Bank of Chile. Even though there might be differences in their figures, trends are usually similar. • Differences between 2 main sources: • Tariff Codes are different • Intermediate destination sometimes accounted as final • Time gaps until product arrives to destination * 2012 figures fromStatsCan are Jan-Jun 2012 only. * 2012 figures fromStatsCan are Jan-Jun 2012 only. • Figures provided by StatsCan exhibit a positive trend in Trade Balance between 2007 and 2011, driven by an increase in Chilean exports to Canada. Source: StatsCan
International Trade: Chile - Canada Chilean exports to Canada are concentrated in few products. Based on Statistics Canada’s figures, the top 3 exported products (Gold, Silver and Grapes) accountedfor 54% of total exportsto Canada in 2011. Likewise, the top 6 exportedproducts (+ Copper, Wine and Fish) explained 71% of total. Source: StatsCan In 2011, minerals accounted for almost half of total Chilean Exports to Canada. In terms of products, Gold has increased significantly its share in the past few years, while Copper has exhibited the opposite trend. Source: StatsCan
ProChile Canada ProChile Canada contributes to Chile’s economic development through its promotion abroad, supporting Chilean exporters to the internationalization of their business in a sustainable path. Likewise, enhancing the promotion of investment and tourism are new strategic targets to achieve in the upcoming years. • Strengthen our contact network in Canada, with a special focus on its four major provinces • Deliver high quality market research to our Chilean exporters • Organize high quality commercial missions nationwide • Organize investment attraction activities that invite Canadian companies to go to Chile • Positioning Canada as an attractive market for our entrepreneurs TRADE COMMISSION OF CHILE In Canada
Chile’s Next Growth Phase: (2010-2030) Sustainable Growth Increased Productivity Gains Science & Education Innovation & Entrepreneurship
The basic elements of our action plan Chile is a globally integrated economy, with strong foundations and outstanding business environment. We strongly believe that Chile’s Next Growth Phase (2010-2030) should arise from becoming a Regional Hub for Entrepreneurship & Innovation.
2013: The year of innovation Competition for a better business environment Emblematic Projects A new culture for innovation
New registered activities on an historical record Earthquake Record of creation of new companies Financial crisis 2002=100 Source: Chilean IRS
A hub for Global Entrepreneurs (Snapshot – nota The Economist – October 13th., 2012)
New R&D Tax Credit • 35% Tax Credit for all R&D expenditure (remaining 65% is tax deductible) = almost 50% of R&D is “paid” by Gov. • All R&D expenditures are allowed, incl operational expenses, real and personal property, payroll, etc • R&D activity can be performed in-house or by third parties, and if needed, up to 50% can be done in a foreign country • Annual maximum tax credit per company (legal entity) is US$1,2 million (however all remaining expenditure is tax deductible) • Tax benefit can be carried forward 10 years • New tax credit law become effective on September 7th 2012 • Law was approved with overwhelming majority from all parties • Law will be valid (i.e. new projects can be certified) until at least 2025
Centres of Excellence: First Institutional Call – A success!
Centres of Excellence 2.0 — New Round! • This 2nd Call will not have ex-ante sector or industry priorities in place. • Proposals tackling high impact areas for Chile’s economy (or even with the potential of creating new industries and leverage regional platforms) will be valued better off. • Proposals may leverage additional regional funds within the country. • Projects should contribute to position Chile as an innovation hub within Latam. • Target are Centers with investment close to USD24M • Institutional Centers: USD 12.8M in 8 years • Corporate Centers: USD 8M in 4 years and 1:2 funding
Trade Commission of Chile | ProChile - Canada 2 Bloor Street West, Suite 1801, Toronto, Ontario Tel.: 416-924-0176 jafigueroa@prochile.gob.cl DISCLAIMER: The information contained in this document is for the purposes of information only and the particular conditions of each specific potential project may vary from those set out here. The contents of this document should in no way be interpreted as a legally binding obligation of the Republic of Chile or any other state agency that participates in any way in the processes of administrative approval or of any other nature corresponding under Chilean law. This information in no way constitutes an authorization to start or exercise the economic activity potentially intended to be developed. The resulting agreements will be governed and interpreted exclusively according to the laws of the Republic of Chile, their related regulation and the national policies applicable to each particular case.