Download
1 / 52
570 likes | 804 Views
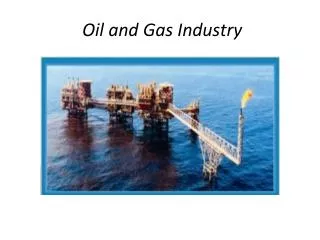
Oil and Gas Industries. Bill Pyke Hilbre Consulting Limited, October 2012. Delivered to:. Oil and Gas Development and Production. Outline. Offshore Developments Producing oil and gas wells and surface facilities Transportation; pipelines and tankers The cost of production.

E N D
Oil and Gas Industries Bill Pyke Hilbre Consulting Limited, October 2012 Delivered to: Oil and Gas Development and Production
Outline • Offshore Developments • Producing oil and gas wells and surface facilities • Transportation; pipelines and tankers • The cost of production
Exploration & Production Sequence $m. Yrs 0+ 0-10+ Application & Award of Permit - Licencing 1-3 1 Exploration – Prospect Identification 1-20 1+ Exploration – Exploration Drilling 2-15+ 1-3 Appraisal of Discovery - reduce the uncertainties Development – FEED studies design & build surface facilities, devt drilling 100-1000’s 1-4 Production 10+
Funds flow in Upstream Operations Gross Revenues Exploration Tax & Royalty Development Allowances Operating Net Revenue
The Progress from Discovery to Development The exploration phase involves drilling of discovery wells. The additional wells are referred to as appraisal or delineation wells. They are required to provide more information on the size, shape and petroleum volumes in the field. On declaration of a commercial discovery, a plan of development is put in place. The type of development depends costs, environmental conditions and prevailing legislation.
Drilling in Offshore Oil and Gas Fields The early discoveries of oilfields were made in The United States and Baku in the Caspian region in the later parts of the 19th century. These operations entailed the drilling of a large number of closely-spaced wells. In the earlier part of the twentieth century the oilfields in Oklahoma and West Texas were developed by so-called pattern drilling in which the producing wells were sited on an acre spacing grid. The evolution of improved reservoir management techniques and improving technology led to fewer wells being required. These wells were drilled from centralised surface gathering facilities. The technique of deviating wells enabled drillers to ‘steer’ their wells to designated subsurface target locations.
Drilling Technology 1925 Drilling in Oklahoma in the 1920s 7
Offshore Development Options Source: Natural History Museum /UKOOA
Deep Water Fixed Steel Jackets Deepwater Jackets similar to the one above have been used to develop reserves in water depths in the range of 250-350metres in the Gulf of Mexico
North Sea Oil Production Platform DrillingRig Helideck Accommodation Modules FlareBoom Oil risers
Production Wells:Development With Deviated Drilling Programme Source: Britain’s Offshore Oil and Gas, UKOOA/ Natural History Museum(1997)
A generic North Sea field area overlain on a central London map Source: Britain’s Offshore Oil and Gas, UKOOA/ Natural History Museum(1997)
Floating Systems Source: Total
Oil & Gas RecoveryConcepts • Oil/Gas occupies pore spaces in sedimentary rock • Extraction leads to voidage replacement by water (below the oil horizon) in the oilfield or gas (above the oil horizon) in the oilfield • Natural oilfield recoveries are referred to as primary recovery and are dependent on the energy and physical conditions in the oilfield. Recoveries range from 10-35%. • Water and/or gas injection can increase recoveries and known as secondary recovery • Natural gas recoveries are commonly much higher than oil; 70-85%
Recovery Recovery influenced by:- • Natural reservoir conditions: porosity and permeability • Nature of the petroleum fluids: oil, gas, NGLs and condensate • Prevalent economic conditions: costs and prices • Location of oil/gas field
Recovery (2)- Global Figures • Oil resource/endowment 11 trillion barrels (11x1012 barrels) • Proven Reserves 1.4 trillion barrels (1.4x 10¹² barrels) • Historic Global Recovery factor 11%, 89% still in the ground! • Current global-averaged field recovery factor 22% • Improved/enhanced recovery could get to 70% recovery • Each 1% improvement yields 100billion barrels which is 5 years global supply
Behaviour of Reservoir Fluids in Production • Oil and Gas fields in production lead to changes in pressures, volumes and fluid content of the period of production • Many fields have good natural recoveries based on high original pressures in the reservoir. A good aquifer provides support • Recovery of petroleum volumes (reserves) can often be enhanced
The Natural Drive Mechanisms for Recovery (1) Bottom and Edge Water Drive The aquifer system underlying the hydrocarbon accumulation provides the energy for driving hydrocarbons to the well bore. Combination Drive Both the aquifer and free gas both provide the energy to drive hydrocarbons to the well bore. Edge drive Bottom drive
The Natural Drive Mechanisms for Recovery (II) Gas Cap Drive This type of Reservoir has no aquifer system. It consists of a saturated oil with a gas cap. A free gas phase is in equilibrium with the oil Acting like a piston the expanding gas cap drives down into the Reservoir sustaining the production rates of the oil wells. Gas Cap Drive
Reservoir Pressure Trends for Reservoirs Under Various Drives 100 80 Water Drive 60 Reservoir Pressure - % of Original 40 Gas Cap Drive 20 Dissolved Gas Drive 0 20 40 60 Oil Production - % of Original Oil-in-Place
Secondary Recovery Source: Technip
Example: Ghawar Oilfield, Saudi Arabia Source: Saudi Aramco
Improvements with Secondary RecoveryHandil Oilfield, Indonesia BPMigas, 2006
Recovery Targets for the Major North Sea Operators 64% 57% 45% 38% Percentage Recovery Historically 38% of in place volumes was considered a typical North Sea recovery factor. With modern technology and cost efficient methods the recovery factors can approach, and even exceed, 60%.
Enhanced Recovery (EOR) Additional energy is often needed to enhance the production rate and ultimate recovery of reserves. Some Examples; Miscible Flood CO2 Miscible Flood WAG Foam+CO2 Thermal Steam Flood Fire Flood Injection Chemical Injection Fracturing
Thermal Recovery -Steam Injection • Steam reduces viscosity of heavy oil and improves recovery • Used in many fields in onshore California, Indonesia
Steam Injection, Indonesia BPMigas, 2006
Reservesand Production Profiles • Reserves are a stock (inventory) asset • Production is flow and therefore a revenue stream • Translating reserves to production involves costs- capital, operating and transport • Reserves = Production rate x time • Ultimate reserves are a function of:- • Prices • Costs • Field characteristics and performance • Type of petroleum • Location
The Recovery Factor and the Production Profile 1) Physical Conditions - Drive System - Reservoir Quality - Enhanced Recovery - Reservoir Compartmentation - New Reserves 2) Commercial/Financial Aspects - Market - Transport - Price - Operating Cost 3) Environmental Aspects - Restrictions on production rate - Flaring?
The Production Decline Curve Method From existing history the estimator will use a methodology which incorporates producing wells, gas lift installation, workovers, effect of the reservoir drive mechanism. Four types of decline curve generally exist: - Linear - Exponential - Hyperbolic - Harmonic Most production rate/time graphs have been found to exhibit exponential or hyperbolic decline.
Rapid Production Plateau Rate Oilfield Profile Small Gasfield Profile Production Profile Options Production Time
Economic Cut-off Production Rates For Cessation of Production 100000 10000 UKCS FPSO 6000 bopd 1000 Production Rate/DayLog Scale Onshore Field Eastern England 100 bopd 100 Stripper Well, Oklahoma 10 2.74 yrs 13.65 yrs 21.91 yrs 0 1000 2000 3000 4000 5000 6000 7000 8000 Days in Production
Categories of Supply Cost(Global Average in Brackets) Finding- Exploration: lease costs, exploration & appraisal wells seismic, overheads ($3-5/bbl) Developing- production wells, surface plant, export pipelines ($17/bbl) Production-lifting and related operating costs ($8/bbl) Transportation and Tariff- export pipeline, shipping costs ($2/bbl) Abandonment: decommissioning costs at the end of production ($2/bbl)
Forties Pipeline System U.K. North Sea Source: BP
Marine Tankers and Worldscale Rates • The world tanker fleet had 4,186 vessels with a carrying capacity of 358,800 dwt. • 84% of the tanker fleet were owned by independent tanker companies. • The average age of the fleet was 11.9 years. • World Scale Freight Index used as a starting point for negotiating costs • World scale 100's, reflect application of tanker operating cost assumption to the ports and distance/steaming time on route. These “flat rates” appear in US dollars per ton of cargo. • The freight for a given ship and voyage is normally expressed in a percentage of the published rate and is supposed to reflect the freight market demand at the time of contract