Download
1 / 14
140 likes | 326 Views
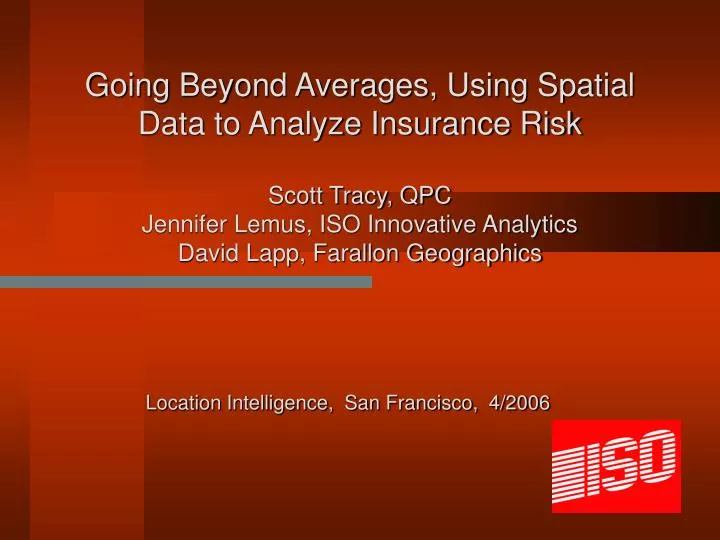
Going Beyond Averages, Using Spatial Data to Analyze Insurance Risk Scott Tracy, QPC Jennifer Lemus, ISO Innovative Analytics David Lapp, Farallon Geographics. Location Intelligence, San Francisco, 4/2006. What determines how much you pay for Auto Insurance?.

E N D
Going Beyond Averages, Using Spatial Data to Analyze Insurance Risk Scott Tracy, QPC Jennifer Lemus, ISO Innovative Analytics David Lapp, Farallon Geographics Location Intelligence, San Francisco, 4/2006
What determines how much you pay for Auto Insurance? • Personal History (Accidents/Violations) • Type of Vehicles • Driving Conditions • Historically, these have been evaluated by averaging the loss experience in a given geographic area (typically a collection of zip codes)
Issues with Current Insurance Practices • Zip codes were constructed for the convenience of the Post Office • Zip codes are not homogenous when it comes to insurance risk, demographics
ZIP Code 94109: A Tour Fishermen’s Wharf The Tenderloin: "...the haunt of the low and vile of every kind. ….Licentiousness, debauchery, pollution, loathsome disease, insanity from dissipation, misery, poverty, blasphemy and death are there. And Hell, yawning to receive the putrid mass, is there also. “ Robert Louis Stevenson declared "Nob Hill, the Hill of Palaces, must certainly be counted the best part of San Francisco." Japantown
Factors that affect Driving Conditions • Businesses • Street Types • Use of Mass Transit • Weather • Commute Patterns • Population Density
Geoprocessing Requirements Number of features per type (SIC, CFCC etc) per distance Business locations (~3M) Landmark locations (~1M) Distance to nearest per type Block Groups (~200K) Traffic data locations (~1M) Nearest traffic data Elevation data (~250M) Elevation statistics (avg, var, min, max) Past: ~300 parameters per Block Group... ~60M values Present: ~500 parameters per Block Group...~100M values Future: Process ~20M Policy Locations... Billions of values! QPC predictive analysis Traditional non location-based analytic data
Technology evaluation Technology Options • In-house software development • GIS • Spatial RDBMS Technical Requirements • Scalability • Performance • Flexibility • Selected Oracle 10g Spatial for geoprocessing • Server-side processing • Extremely scalable to support expected growth • Interoperable with GIS when functionality becomes necessary
Geoprocessing overview Oracle 10g Spatial Nation-wide Source Locations (Census Block Groups, Policy Locations etc) Nation-wide Target Locations (Businesses, Landmarks, Traffic, Elevation etc) Geoprocessing results Rapid construction of spatial data warehouse ~400 location-based values / sec ~30M location-based values / day (on less than state-of-the art h/w) Standard Oracle development best practices applied to geoprocessing: Indexing (incl Spatial), Partitioning (incl Spatial), and many other optimization techniques QPC analysis platforms GIS platforms Web mapping apps SQL/Java API
Geoprocessing User Interface Asynchronous complete geoprocessing Test bed geoprocessing Results review and extraction for SAS etc
Effect of Different Traffic Generators Increase in physical damage claims by living within one mile of:
Improve over current practices Gini Indexes (representing gains over random model)
Thanks for attending! stracy@qualityplanning.com jlemus@qualityplanning.com dlapp@fargeo.com