Download
1 / 29
290 likes | 295 Views
Overview. Data Mining - classification and clustering Various distance metrics Minkowski, Manhattan, Euclidian, Max, Canberra, Cord, and HOBbit distance - Neighborhoods and decision boundaries P-trees and its properties k-nearest neighbor classification

E N D
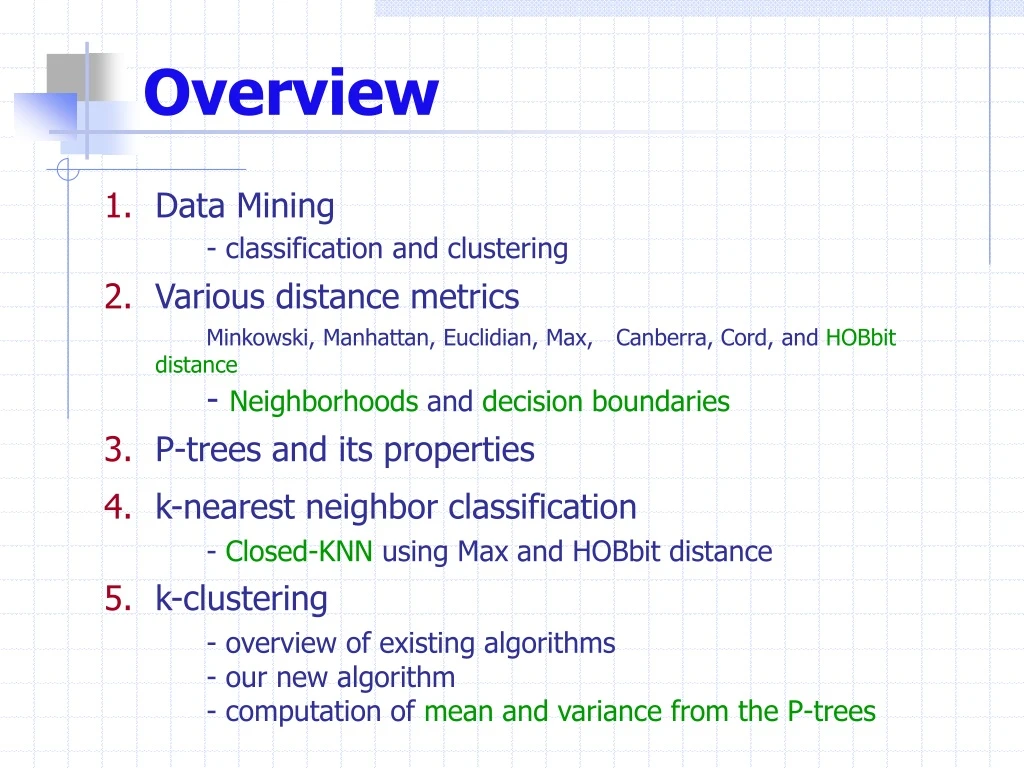
Overview • Data Mining • - classification and clustering • Various distance metrics • Minkowski, Manhattan, Euclidian, Max, Canberra, Cord, and HOBbit distance • - Neighborhoods and decision boundaries • P-trees and its properties • k-nearest neighbor classification • - Closed-KNN using Max and HOBbit distance • k-clustering • - overview of existing algorithms • - our new algorithm • - computation of mean and variance from the P-trees
Data Mining extracting knowledge from a large amount of data Useful Information (sometimes 1 bit: Y/N) More data volume = less information Data Mining Raw data Information Pyramid Functionalities: feature selection,association rule mining, classification & prediction, cluster analysis, outlier analysis
Training data: Class labels are known Feature1 Feature2 Feature3 Class a1 b1 c1 A a2 b2 c2 A a3 b3 c3 B Sample with unknown class: Classifier Predicted class Of the Sample a b c Classification Predicting the class of a data object also called Supervised learning
Types of Classifier Eager classifier: Builds a classifier model in advance e.g.decision tree induction, neural network Lazy classifier: Uses the raw training data e.g. k-nearest neighbor
A two dimensional space showing 3 clusters Clustering • The process of grouping objects into classes, • with the objective: the data objects are • similar to the objects in the same cluster • dissimilar to the objects in the other clusters. • Clustering is often calledunsupervised learning • or unsupervised classification • the class labels of the data objects are unknown
Distance Metric Measures the dissimilarity between two data points. A metric is a fctn, d, of 2 n-dimensional points X and Y, such that d(X, Y)is positive definite: if (X Y), d(X, Y) > 0 if (X = Y), d(X, Y) = 0 d(X, Y) issymmetric: d(X, Y) = d(Y, X) d(X, Y) satisfies triangle inequality:d(X, Y) + d(Y, Z) d(X, Z)
Various Distance Metrics Minkowski distance or Lp distance, Manhattan distance, (P = 1) Euclidian distance, (P = 2) Max distance, (P = )
Y (6,4) Z X (2,1) An Example A two-dimensional space: Manhattan, d1(X,Y)= XZ+ ZY =4+3 = 7 Euclidian, d2(X,Y)= XY = 5 Max, d(X,Y)= Max(XZ, ZY) = XZ = 4 d1d2 d For any positive integer p,
Some Other Distances Canberra distance Squared cord distance Squared chi-squared distance
Bit position: 1 2 3 4 5 6 7 8 1 2 3 4 5 6 7 8 x1: 0 1 10 1 0 0 1 x2: 0 1 0 11 1 0 1 y1: 0 1 11 1 1 0 1 y2: 0 1 0 1 0 0 0 0 HOBbitS(x1, y1) = 3 HOBbitS(x2, y2) = 4 HOBbit Similarity Higher Order Bit (HOBbit) similarity: HOBbitS(A, B) = A, B: two scalars (integer) ai, bi :ith bit of A and B (left to right) m : number of bits
The previous example: Bit position: 1 2 3 4 5 6 7 8 1 2 3 4 5 6 7 8 x1: 0 1 10 1 0 0 1 x2: 0 1 0 11 1 0 1 y1: 0 1 11 1 1 0 1 y2: 0 1 0 1 0 0 0 0 HOBbitS(x1, y1) = 3 HOBbitS(x2, y2) = 4 dv(x1, y1) = 8 – 3 = 5 dv(x2, y2) = 8 – 4 = 4 The HOBbit distance between two pointsX and Y: In our example (considering 2-dimensional data): dh(X, Y) = max (5, 4) = 5 HOBbit Distance The HOBbit distance between two scalar value A and B: dv(A, B)= m – HOBbit(A, B)
HOBbit Distance Is a Metric HOBbit distance is positive definite if (X = Y), = 0 if (XY), > 0 HOBbit distance is symmetric HOBbit distance holds triangle inequality
2r 2r 2r 2r X X X X T T T T Neighborhood of a Point Neighborhood of a target point, T, is a set of points, S, such thatXSif and only if d(T, X) r Manhattan Euclidian Max HOBbit If Xis a point on the boundary, d(T, X) = r
Manhattan Euclidian Max Max Euclidian Manhattan > 45 < 45 X A A A A A R1 B B B B B d(A,X) d(B,X) R2 D Decision Boundary decision boundary between points A and B, is the locus of the point X satisfying d(A, X) = d(B, X) Decision boundary for HOBbit Distance is perpendicular to axis that makes max distance Decision boundaries for Manhattan, Euclidean and max distance
Notations rc(P) : root count of P-tree P N :number of pixels n : number of bands m :number of bits P1& P2:P1AND P2 P1 | P2 :P1OR P2 P´:COMPLEMENT of P Pi, j : basic P-tree for band i bit j. Pi(v) : value P-tree for value v of band i. Pi([v1, v2]) : interval P-tree for interval [v1, v2] of band i. P0 : is pure0-tree, a P-tree having the root node which is pure0. P1 : is pure1-tree, a P-tree having the root node which is pure1.
Properties of P-trees 1. a) b) 2. a) b) c) d) 3. a) b) c) d) • 4. rc(P1 | P2)= 0 rc(P1)= 0andrc(P2) = 0 • v1 v2 rc{Pi(v1)& Pi(v2)} = 0 • rc(P1 | P2) = rc(P1) + rc(P2) - rc(P1 & P2) • rc{Pi (v1) | Pi(v2)} = rc{Pi(v1)} + rc{Pi(v2)}, where v1 v2
1 word 2 words 2 words 4 words 4 words Format Code Fan-out # of levels Root count Length of the body in bytes Body of the P-tree P-tree Header Header of a P-tree file to make a generalized P-tree structure
k-Nearest Neighbor Classification 1) Select a suitable value for k 2) Determine a suitable distance metric 3)Find k nearest neighbors of the sample using the selected metric 4) Find the plurality class of the nearest neighbors by voting on the class labels of the NNs 5) Assign the plurality class to the sample to be classified.
T Closed-KNN T is the target pixels. With k = 3, to find the third nearest neighbor, KNN arbitrarily select one point from the boundary line of the neighborhood Closed-KNN includes all points on the boundary Closed-KNN yields higher classification accuracy than traditional KNN
SearchingNearestNeighbors We begin searching by finding the exact matches. Let the target sample, T = <v1, v2, v3, …, vn> The initial neighborhood is the point T. We expand the neighborhood along each dimension: along dimension i, [vi] is expanded to the interval [vi – ai , vi+bi], for some positive integers ai and bi. Continue expansion until there are at least k points in the neighborhood.
HOBbit Similarity Method for KNN In this method, we match bits of the target to the training data Fist we find matching in all 8 bits of each band (exact matching) let, bi,j = jth bit of the ith band of the target pixel. Define Pti,j = Pi,j, if bi,j = 1 = Pi,j, otherwise And Pvi,1-j = Pti,1 & Pti,2 & Pti,3 & … & Pti,j Pnn = Pv1,1-8&Pv2,1-8&Pv3,1-8 & … &Pvn,1-8 If rc(Pnn) < k, update Pnn = Pv1,1-7 & Pv2,1-7 & Pv3,1-7 & … & Pvn,1-7
An Analysis of HOBbit Method • Let ith band value of the target T, vi= 105 = 01101001b • [01101001] = [105, 105] • 1st expansion • [0110100-] = [01101000, 01101001] = [104, 105] • 2nd expansion • [011010--] = [01101000, 01101011] = [104, 107] • Does not expand evenly in both side: • Target = 105 and center of [104, 111] = (104+107) / 2 = 105.5 • And expands by power of 2. • Computationally very cheap
Perfect Centering Method Max distance metric provides better neighborhood by - keeping the target in the center - and expanding by 1 in both side Initial neighborhood P-tree (exact matching): Pnn = P1(v1)& P2(v2)& P3(v3) & … &Pn(vn) If rc(Pnn) < k Pnn = P1(v1-1, v1+1)& P2(v2-1, v2+1)& … & Pn(vn-1, vn+1) If rc(Pnn) < k Pnn = P1(v1-2, v1+2)& P2(v2-2, v2+2)& … & Pn(vn-2, vn+2) Computationally costlier than HOBbit Similarity method But a little better classification accuracy
Finding the Plurality Class Let, Pc(i) is the value P-trees for the class i Plurality class =
Performance Experimented on two sets of Arial photographs of The Best Management Plot (BMP) of Oakes Irrigation Test Area (OITA), ND Data contains 6 bands: Red, Green, Blue reflectance values, Soil Moisture, Nitrate, and Yield (class label). Band values ranges from 0 to 255 (8 bits) Considering 8 classes or levels of yield values: 0 to 7
Performance – Accuracy 1997 Dataset:
Performance - Accuracy (cont.) 1998 Dataset:
Performance - Time 1997 Dataset: both axis in logarithmic scale
Performance - Time (cont.) 1998 Dataset : both axis in logarithmic scale