Download

1 / 47
480 likes | 657 Views
19. The Goods Market in an Open Economy. The IS Relation in the Open Economy. 19-1. The Demand for Domestic Goods In an open economy, the demand for domestic goods is given by:. The IS Relation in the Open Economy. In an open economy, the “domestic demand for goods” …

E N D
19 The Goods Marketin an Open Economy
The IS Relation inthe Open Economy 19-1 The Demand for Domestic Goods • In an open economy, the demand for domestic goods is given by:
The IS Relation inthe Open Economy • In an open economy, the “domestic demand for goods” … • (foreign or domestic goods, demanded by domestic residents) • …is not the same as the “demand for domestic goods” • (domestic goods, bought by domestic or foreign residents)
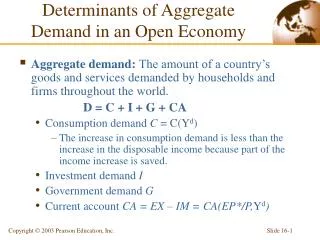
The Demand for Domestic Goods The Determinants of C, I, and G The real interest rate r = i – expected inflation
The Demand for Domestic Goods The Determinants of C, I, and G • The real exchange rate does not affect the overall level of consumption and investment. • It is income, taxes, and the real interest rate that determine how many consumer or capital goods a country should buy. • E does affect the composition of consumption and investment. • Should we buy foreign or domestic goods?
The Demand for Domestic Goods The Determinants of Imports • A higher real exchange rate makes foreign goods relatively more expensive, leading to a decrease in the quantity of imports.
The Demand for Domestic Goods The Determinants of Exports • An increase in Y*, or foreign output, leads to higher U.S. exports. An increase in , the value of foreign goods in terms of domestic goods, also leads to an increase in exports.
The Demand for Domestic Goods • C + I + G includes some demand for foreign goods. • We must exclude imports to obtain the domestic demand for domestic goods. • The AA curve is flatter than the DD curve: • If income increases… • …some of the extra income goes to saving, • some of the extra income goes to domestic goods, • and some of the extra income goes to imports, which are now excluded.
The Demand for Domestic Goods The Demand for Domestic Goods and Net Exports • The domestic demand for goods, DD, is an increasing function of income, so DD is upward-sloping. • But we must exclude imports: the domestic demand for domestic goods, AA, we must subtract the value of imports from domestic demand.
The Demand for Domestic Goods • AA is just the domestic demand for domestic goods: • It’s the amount spent by domestic residents on domestic goods. • So it doesn’t include imports. • …but it doesn’t include exports, either. • Since exports are also part of domestic production, we want to count them.
The Demand for Domestic Goods The Demand for Domestic Goods and Net Exports Adding the amount of exports to the domestic demand for domestic goods, AA, we obtain the (total) demand for domestic goods, ZZ.
The Demand for Domestic Goods Autonomous consumption –mpc(T) + autonomous investment + G= 500- .5(400) +500-2000r+500 = 1300+2000(0.05) =1400 DD Slope =0.5+0.1=0.6
The Demand for Domestic Goods Slope=0.6 DD Autonomous consumption –mpc(T) + autonomous investment + G + X - eIM= =1600 ZZ Slope = 0.6-0.1=0.5 =1400
The Demand for Domestic Goods The Demand for Domestic Goods and Net Exports The trade balance (X – IM) is a decreasing function of output. Higher income raises IM but leaves X constant, reducing the trade balance. YTB is the value of output that corresponds to balanced trade.
Equilibrium Outputand the Trade Balance 19-2 Equilibrium Output and Net Exports The goods market is in equilibrium when production is equal to the demand for domestic goods. At the equilibrium level of output, the trade balance may show a deficit or a surplus.
Saving, Investment,and the Trade Balance 19-6 • So far, we’ve been looking at equilibrium by asking: • At what value of Y is Y = Expenditure? • Knowing that expenditure is a function of Y. • Alternatively, we could look at equilibrium by asking: • At what level of Y is S = I? • Knowing that S and I are both functions of Y.
Saving, Investment,and the Trade Balance • The S=I condition for equilibrium has an important meaning: • We know and that
Saving, Investment,and the Trade Balance • A trade surplus must correspond to an excess of saving over investment, and vice versa. • If saving remains constant, an increase in investment results in a deterioration of the trade balance. • An increase in the budget deficit, all else the same, leads to a deterioration of the trade balance.
Increases in Demand,Domestic or Foreign 19-3 The Effects of an Increase in Government Spending An increase in government spending leads to an increase in output and to a trade deficit. The effect of government spending in the open economy is smaller—the multiplier is smaller—than it would be in a closed economy. because some spending “escapes” into the rest of the world and is not multiplied.
Increases in Demand,Domestic or Foreign • In a closed economy, equilibrium output is given by • In an open economy, expenditure is • So equilibrium Y is given by Some spending “leaks” into saving (1-c); some spending “leaks” the rest of the world (eim1) and is not multiplied; therefore the multiplier is smaller.
Increases in Foreign Demand The Effects of an Increase in Foreign Demand An increase in foreign demand leads to an increase in output and to a trade surplus. At point A, the amount demanded by domestic residents is less than the amount of domestic goods demanded. Many domestic goods are demanded, so exports are probably high. Because domestic demand is relatively low (but demand for domestic goods is high), imports are relatively low.
Increases in Foreign Demand The Effects of an Increase in Foreign Demand An increase in foreign demand leads to an increase in output and to a trade surplus. The trade balance improves because the increase in imports does not offset the increase in exports. Note that A’ is an equilibrium even though NX>0. Also note NX = X – IM is equal to the vertical difference between DD and ZZ. NX=0 only when DD and ZZ intersect.
Games That Countries Play • Increases in demand, both foreign and domestic, lead to an increase in output. • However, they have opposite impacts on the trade situation of the country. • An increase in domestic demand increases output but worsens the trade deficit. • An increase in foreign demand is preferred to an increase in domestic demand because it also leads to an improvement in the trade balance. • Trade deficits capital inflows = accumulating debts to foreigners.
Games That Countries Play • Suppose there’s a recession. • An expansionary fiscal policy can eliminate it, but it would generate a trade deficit. • Moreover, since the multiplier is smaller in an open economy, the required increase in G might be very large. • Alternatively, a country may wait for foreign demand to stimulate the economy. • This would give us a trade surplus and an expansion.
Games That Countries Play • What if all countries increased G at the same time? • Then output and import demand would rise for all countries at the same time. IM rise, but X rise too, keeping the trade balance constant. • Coordination among countries, such as the one among the group of seven major countries of the world, or G7, is an attempt to adopt compatible macroeconomic policies.
Games That Countries Play • But what if only some countries have a recession? • Expansionary fiscal policy by all countries might generate inflation in non-recession countries. • Some countries may start with high budget deficits and government debt. • Alternatively, what if countries promise to play as a team and then cheat? • They would benefit from foreign expansion, without the domestic deficit.
Depreciation, the TradeBalance, and Output 19-4 • Suppose a currency loses value vis-à-vis a foreign currency. • This is called a depreciation. • Theory and empirical evidence suggests that, most often, NX will improve with a depreciation. • In this case, a rise in e will have the same effect as an increase in foreign demand: it will increase our output and improve NX.
Depreciation, the TradeBalance, and Output • Will Net Exports improve with a depreciation? • The Quantity of Exports will rise. • The Quantity Imports will fall. • But the domestic price of imports will rise, because the depreciation makes imports more expensive at home. • What will happen to eIM, the value of imports?
Depreciation, the TradeBalance, and Output • As rises, • The Marshall-Lerner condition is the condition under which a real depreciation (an increase in ) leads to an increase in net exports. • It’s all about elasticity: assume |%DIM| > |%De|
Depreciation, the TradeBalance, and Output • If the Marshall-Lerner condition holds
Depreciation, the TradeBalance, and Output • In this chapter, we will assume prices are fixed. • This means that a change in E is the same as a change in e.
Depreciation, the TradeBalance, and Output • Chapter 21 shows that even though a nominal depreciation may have a short-run effect… • when prices are flexible, in the medium run, a change in E never changes e and therefore doesn’t change output.
The Effects of a Depreciation The Effects of a Depreciation A real depreciation leads to an increase in output and an improvement in the trade balance. A depreciation works by making foreign goods relatively more expensive for us … … and making domestic goods cheaper for foreigners.
The Effects of a Depreciation • Increases in foreign income and depreciations have the same effects on income and the trade balance. • Because both increase foreign demand for domestic goods, Y and TB increase.
The Effects of a Depreciation • But depreciations reduce the purchasing power of our income and makes imports more expensive. • What if you worked for a company that imported foreign raw materials and exported the output? • What if most of your food was imported? • Depreciations are equivalent to an across the board wage-cut. • It makes everyone’s labor cheaper but also everyone poorer. They don’t improve productivity.
Combining Exchange-Rateand Fiscal Policies Reducing the Trade Deficit Without Changing Output To reduce the trade deficit without changing output, the currency must depreciate and the government must decrease spending. A depreciation will increase output, while reduced government spending will decrease output.
Combining Exchange-Rateand Fiscal Policies • Full-employment Output and Trade Balance are two different goals. • Exchange-rate depreciation and fiscal policy are two different tools. • You may need two tools to be able to achieve two goals.
Looking at Dynamics:The J-Curve 19-4 • The Marshall-Learner condition says that • The key point is that imports are relatively elastic: a given percentagechange in e will cause alarge change in IM.
Looking at Dynamics:The J-Curve • But Imports aren’t always elastic. • Prices and quantities of imports are set through contracts, which may last many months or years. • Imports are very inelastic with respect to changes e, in the very short run. • As time goes on, eelasticity of IM rises.
Looking at Dynamics:The J-Curve • A depreciation may lead to an initial deterioration of the trade balance; increases, but neither X nor M adjusts very much initially. • Eventually, exports and imports respond, and depreciation leads to an improvement of the trade balance.
Looking at Dynamics:The J-Curve The J-Curve A real depreciation leads initially to a deterioration, then to an improvement of the trade balance. Starting from a trade deficit, a depreciation first causes a deterioration of NX, but later an improvement: a J-curve, where NX first dips and then improves.
Looking at Dynamics:The J-Curve The Real Exchange Rate and the Ratio of Net Exports to GDP: United States, 1980-1990 The real appreciation and the depreciation of the dollar in the 1980s were reflected in increasing, then decreasing trade deficits. There were, however, substantial lags in the effects of the real exchange rate on the trade balance.