Download
1 / 23
230 likes | 234 Views
Learn how to use box and whisker plots and calculate quartiles to analyze data sets. Explore examples and practice problems.

E N D
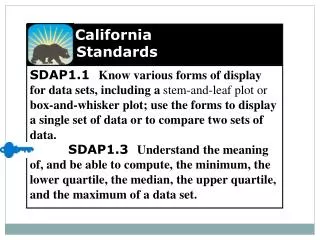
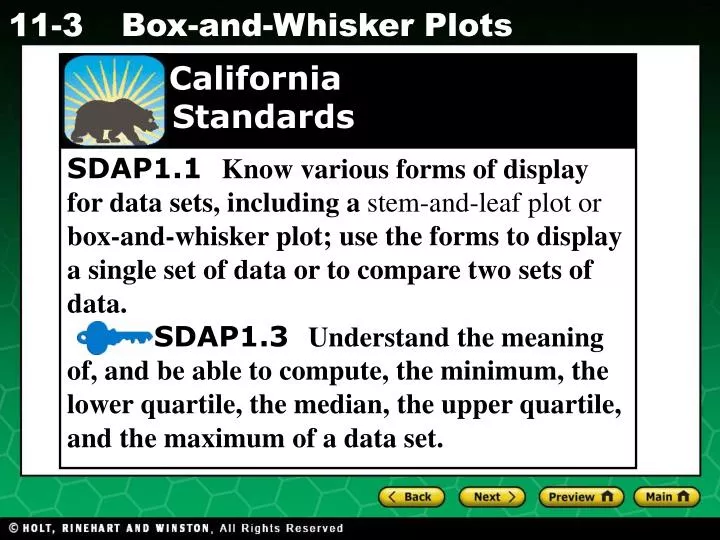
California Standards SDAP1.1 Know various forms of display for data sets, including a stem-and-leaf plot or box-and-whisker plot; use the forms to display a single set of data or to compare two sets of data. SDAP1.3 Understand the meaning of, and be able to compute, the minimum, the lower quartile, the median, the upper quartile, and the maximum of a data set.
Vocabulary lower quartile upper quartile box-and-whisker plot minimum maximum
The table below summarizes a cat breeder’s records for kitten litters born in a given year. You can divide the data into four equal part using quartiles.
Upper quartile: 5 median of upper half Lower quartile: 3 median of lower half Median: 4 You know that the median of a data set divides the data into a lower half and an upper half. The median of the lower half is the lower quartile, and the median of the upper half is the upper quartile. Kitten Data Lower half Upper half 2 3 3 3 3 3 3 4 4 4 4 4 4 4 4 5 5 5 5 5 5 5 5 5 5 5 6
Additional Example 1: Finding Quartiles Find the lower and upper quartiles for the data set. A. 15, 83, 75, 12, 19, 74, 21 Order the values. 12 15 19 21 74 75 83 lower quartile: 15 upper quartile: 75
63 + 75 2 lower quartile: = 69 79 + 88 2 upper quartile: = 83.5 Additional Example 1: Finding Quartiles Find the lower and upper quartiles for the data set. B. 75, 61, 88, 79, 79, 99, 63, 77 Order the values. 61 63 75 77 79 79 88 99
Check It Out! Example 1 Find the lower and upper quartiles for the data set. A. 25, 38, 66, 19, 91, 47, 13 Order the values. 13 19 25 38 47 66 91 lower quartile: 19 upper quartile: 66
33 + 45 2 lower quartile: = 39 49 + 59 2 upper quartile: = 54 Check It Out! Example 1 Find the lower and upper quartiles for the data set. B. 45, 31, 59, 49, 49, 69, 33, 47 Order the values. 31 33 45 47 49 49 59 69
1 2 3 4 5 6 7 8 9 A box-and-whiskerplot shows the distribution of data. The middle half of the data is represented by a “box” with a vertical line at the median. The lower fourth and upper fourth quarters are represented by “whiskers” that extend to the minimum (least) and maximum (greatest) values. Lower quartile Upper quartile Median
15 + 17 2 21 + 21 2 upper quartile: = 21 lower quartile: = 16 19 + 19 2 median: = 19 Additional Example 2: Making a Box-and-Whisker Plot Use the given data to make a box-and-whisker plot. 21, 25, 15, 13, 17, 19, 19, 21 Step 1. Order the data from least to greatest. Then find the minimum, lower quartile, median, upper quartile, and maximum. 13 15 17 19 19 21 21 25 minimum: 13 maximum: 25
12 14 16 18 20 22 24 26 28 Additional Example 2 Continued Use the given data to make a box-and-whisker plot. Step 2. Draw a number line and plot a point above each value from Step 1. 13 15 17 19 19 21 21 25
12 14 16 18 20 22 24 26 28 Additional Example 2 Continued Use the given data to make a box-and-whisker plot. Step 3. Draw the box and whiskers. 13 15 17 19 19 21 21 25
31 + 33 2 24 + 26 2 upper quartile: = 32 lower quartile: = 25 29 + 31 2 median: = 30 Check It Out! Example 2 Use the given data to make a box-and-whisker plot. 31, 23, 33, 35, 26, 24, 31, 29 Step 1. Order the data from least to greatest. Then find the minimum, lower quartile, median, upper quartile, and maximum. 23 24 26 29 31 31 33 35 minimum: 23 maximum: 35
22 24 26 28 30 32 34 36 38 Check It Out! Example 2 Continued Use the given data to make a box-and-whisker plot. Step 2. Draw a number line and plot a point above each value. 23 24 26 29 31 31 33 35
22 24 26 28 30 32 34 36 38 Check It Out! Example 2 Continued Use the given data to make a box-and-whisker plot. Step 3. Draw the box and whiskers. Step 2. Draw a number line and plot a point above each value. 23 24 26 29 31 31 33 35
Additional Example 3: Comparing Data Sets Using Box-and-Whisker Plots These box-and-whisker plots compare the ages of the first ten U.S. presidents with the ages of the last ten presidents (through George W. Bush) when they took office.
Additional Example 3 Continued A. Compare the medians and ranges. The median for the first ten presidents is slightly greater. The range for the last ten presidents is greater.
Additional Example 3 Continued B. Compare the ranges of the middle half of the data for each. The range of the middle half of the data is greater for the last ten presidents.
Oakland 0 3 6 9 12 15 18 Tampa Bay 0 3 6 9 12 15 18 Check It Out! Example 3 These box-and-whisker plots compare the points per quarter at Super Bowl XXXVII.
Oakland 0 3 6 9 12 15 18 Tampa Bay 0 3 6 9 12 15 18 Check It Out! Example 3A A. Compare the medians and ranges. The median for Tampa Bay is significantly greater and the range for Tampa Bay is slightly greater.
Oakland 0 3 6 9 12 15 18 Tampa Bay 0 3 6 9 12 15 18 Check It Out! Example 3B B. Compare the ranges of the middle half of the data for each. The range of the middle half of the data is greater for Tampa Bay.
Lesson Quiz: Part I Find the lower and upper quartiles for each data set. 1. 48, 52, 68, 32, 53, 47, 51 2. 3, 18, 11, 2, 7, 5, 9, 6, 13, 1, 17, 8, 0 lower = 47; upper = 53 lower = 2.5; upper = 12
78 87 91 94 98 Lesson Quiz: Part II Use the following data for problems 3 and 4. 91, 87, 98, 93, 89, 78, 94 3. Make a box-and-whisker plot. 4. What is the median and range of the data? 91; 20