Download
1 / 9
90 likes | 188 Views
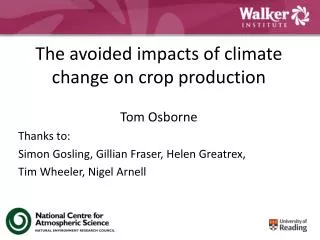
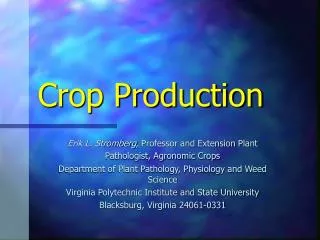
Crops and Climate Group. Impacts of climate on tropical crop production. Tom Osborne a Andy Challinor a,b , Tim Wheeler b , Julia Slingo a a Department of Meteorology b Department. of Agriculture. general circulation model. crop model.

E N D
Crops and Climate Group Impacts of climate on tropical crop production Tom Osbornea Andy Challinora,b, Tim Wheelerb, Julia Slingoa a Department of Meteorology b Department. of Agriculture
general circulation model crop model General Large Area Model for annual crops (GLAM; Challinor et al, 2004) • Aims to combine: • the benefits of more empirical approaches (low input data requirements, validity over large spatial scales) with • the benefits of the process-based approach (e.g. the potential to capture intra-seasonal variability, and so cope with changing climates) • Yield Gap Parameter to account for the impact of differing nutrient levels, pests, diseases, non-optimal management etc.
Impact of extremes: rainfall distribution 1975 Total rainfall: 394mm Model: 1059 kg/ha Obs: 1360 kg/ha 1981 Total rainfall 389mm Model: 844 kg/ha Obs: 901 kg/ha
Impacts of extremes - temperature Also observed for rice (above) and groundnut Anthesis ~ time of flowering
Determine a flowering distribution Calculate impact of each high temp episode (this is a sum over all yield-determining flowers). The most severe high temperature episode impacts the harvest index. Simulate tolerance by choice of HTS parameters. Perhaps simulate escape by altering the flowering distribution in response to stress. Modelling high temperature stress
Importance of adaptation Number of years from period 2071-2100 when the total number of pods setting is below 50%. Tolerant crop variety Sensitive crop variety
Use the climate model projections directly. How do we intend to link to EPS? Q & A What have we achieved so far? • Incorporated effects of high temperature stress at flowering on yield and represented response to stress of different crop varieties. What are our main questions requiring discussion in this meeting? • How to get hold of the EPS output – password does not work? AJC
Milestone 6.14: Completion of preliminary probabilistic assessments of climate change impacts using calibrated impact models Due Feb 2008 Task 6.2.10: Preliminary evaluation of the impacts of extreme events … for crops … from available climate projections Ongoing Task 6.2.11: Application of preliminary results from the EPS to impact models for estimating risks of extremes and risks of impacts. Ongoing (2 months unfunded) Which WP6.2 tasks etc will we contribute to and when?