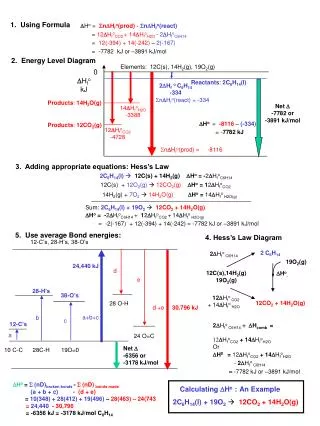
Download
1 / 21
210 likes | 288 Views
Estimating Nerve Axon Density by Automated Processing of High-Resolution Histology Images for Comparison with MR Measurements of Water Diffusion Anisotropy. F. N. Golabchi 1 , W. S. Hoge 2 , H. Mamata 2 , S. Maier 2 , D. H. Brooks 1 1 CDSP Center, Northeastern University

E N D
Estimating Nerve Axon Density by Automated Processing of High-Resolution Histology Images for Comparison with MR Measurements of Water Diffusion Anisotropy F. N. Golabchi1, W. S. Hoge2, H. Mamata2, S. Maier2, D. H. Brooks1 1 CDSP Center, Northeastern University 2 SPL, Brigham and Women’s Hospital and Harvard Medical School
Motivation: Verifying DT-MRI Results • Diffusion-Tensor MRI measures direction and magnitude of water diffusion in tissue • Fractional Anisotropy: • In tissue with fibers (e.g. nerve tissue), DTI is used to find and characterize fibers • How well do these measurements correspond to the anatomy?
KEY Question: • How well do DT-MRI measurements match physiology? • Our Goal: • Extract relevant features from histology data (by spatial domain processing) • Compare features to DT-MRI measurements • Resolution mismatch: • Histology features on the scale of a few pixels • 1 MR pixel corresponds to ~1M histology pixels
Histology Images of Spinal Cord Tissue Histology slice • Digital images of histology sample tissue Through-plane axon regions Gray-matter In-plane axon Histology tile image • Data Acquisition: The tissue is sliced, stained & multiple images taken w/microscope to create a mosaic
Line Scan Diffusion tensor Imaging (LSDI) • Recently developed DT-MRI technique • Free of bulk motion and imaging artifacts • Does not use cardiac gating or head restraints • Does not require special gradient hardware • Could be implemented on conventional scanners
Comparison • In each tile we compare: • DT-MRI data: Fractional Anisotropy (FA) • Histology data: Density of through-plane axons (axon count / axon area) • Register and “re-cut” the histology slice so they match the DT-MRI pixels (a) FA image of slice 03 (b) Histology image of slice 03
Registration Problem • Histology images shrunk/stretch in the staining process • Use anatomical MR (e.g. T1-weighted) images to register the histology images with DT-MR images • Register histology images with T1-weighted images • Register the new histology images with DT-MR images and re-cut them such that one MR pixel correspond to one histology tile (a) T1-weighted image (b) FA image (c) Histology image
Featured problems • 1- In-plane Axon Orientation: Fourier approach • Goal: Measures of dominant direction and degree of anisotropy • Our approach: Two rounds of Fourier Transform at two resolution levels • 2- Through-plane Axon Identification and Segmentation: Density Estimation • Identify through-plane axons • Calculate an axon density measure
Histology Image Preprocessing and Filtering Segmentation and Labeling Watersheds Intensity test Shape Requirements Through-plane Axons Problem 2: Through-plane Axon Segmentation & Density Estimation • Identify objects: • Dark, separated objects Morphological operation to enhance the contrast (image + top-hat - bottom-hat) • Boundaries around local minima Watershed Segmentation (watershed boundaries separate merged objects) • Appropriate intensity-level Gray-level Test (average-intensity) • Certain shape and size Shape-based removals (area, length, circularity)
Intermediate Results: Filtering and Labeling • Thresholding the filtered image • Segmenting the connected components as objects (with pink boundaries) • Problem 1: Merged objects • Problem 2: Objects with non-axon-like shapes
Intermediate Results: Watershed Segmentation and Shape Requirements • Separates merged objects before applying shape constraints Gray-scale image Filtered image • Problem 1: solved Merged objects separated Watershed Lines segment segment • Problem 3: Some low-intensity objects separated and remain in the image as axon candidates & *if* Shape constraints
Final Results: • Compare the average gray-scale value of the objects with a threshold before shape constraints RGBimage Gray-scale Filtered image • Problem 3: solved Low-intensity objects removed • Problem 2: solved Objects with non-axon-like shapes removed *if* Shape requirements & Segmentation Watersheds Intensitytest
Ex. 1: Through-plane axons in histology tile denoted with pink boundaries
Ex. 2: Through-plane axons in histology tile denoted with pink boundaries
Ex. 3: Through-plane axons in histology tile denoted with pink boundaries
Ex. 4: Through-plane axons in histology tile denoted with pink boundaries
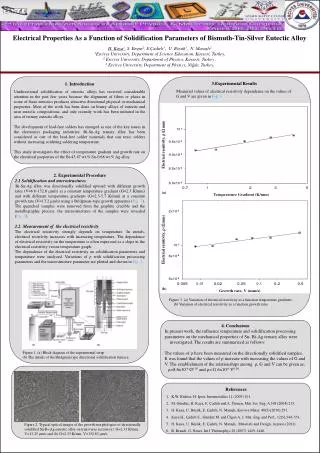
Comparison Results: Axon Area vs. FA (a) FA images (b) Density Images (Density = total area occupied by through-plane axons)
Comparison Remarks 1: • Scatter plot: Scatter plots of fractional anisotropy (FA) of DT-MRI data vs. density measures of histology data (Density= total area occupied by through-plane axons) • Mismatches: mismatches in high FA values
Comparison Remarks 2: • Suggestion: Force manual boundaries to the histology slice for a fair comparison • Problem: Subjective
Conclusion • Using a combination of standard image processing tools (morphological operations, watershed segmentation, image analysis,…) we have developed an algorithm that successfully identifies through-plane axons • Visually, the Densityimages obtained with this algorithm, show strong correlation with FA images obtained from LSDI generated DT-MRI data in most regions, but also show some anomalies in some other regions • Work remains in registration and outlier resolution to numerically quantify the Correlation