Download
1 / 55
550 likes | 563 Views
STAT 102 – Statistics Credit Structure: (2-0) 2 Prof.Dr. Mehmet D. Öner. 2 Exams 30 % each Final exam 4 0 % Textbooks: ELEMENTARY STATISTICS: A STEP BY STEP APPROACH, A.G. Bluman,SEVENTH EDITION Published by McGraw-Hill, 2009 References:

E N D
STAT 102 – Statistics Credit Structure: (2-0) 2 Prof.Dr. Mehmet D. Öner
2 Exams 30 % each Final exam 40 % Textbooks: ELEMENTARY STATISTICS: A STEP BY STEP APPROACH, A.G. Bluman,SEVENTH EDITION Published by McGraw-Hill, 2009 References: Statistical methods for food science : introductory procedures for the food practitioner / by Bower, John A., MSc. Markono Print Media Pte Ltd, 2009
…it is the art and scienceof… • collecting • organizing • presenting data • drawing inferencesfrom a sample of information about an entire population as well as • predicting and developing policy analysis What isMeant by Statistics?
in everyday life Role played by Statistics
Who usesStatistics? Those using Statistical techniques include : Marketers Investors Economists Accountants Sports people Consumers Statisticians Hospitals Quality Controllers Educators Politicians Physicians
Weather Forecasters Who usesStatistics?
Sports Who usesStatistics?
Selecting a good sample In statistics, we have a saying: “Garbage inequals garbage out.” If you select your subjects in a way that is biased — that is, favoring certain individuals or groups of individuals — then your results will also be biased.
Suppose Bob wants to know the opinions of people in your city regarding a proposed casino. Bob goes to the mall with his clipboard and asks people who walk by to give their opinions. What’s wrong with that? Well, Bob is only going to get the opinions of a) people who shop at that mall; b) on that particular day; c) at that particular time; d) and who take the time to respond. That’s too restrictive — those folks don’t represent a cross-section of the city. So,again, these individuals don’t represent all the folks in the city. In order to minimize bias, you need to select your sample of individuals randomly — that is, using some type of “draw names out of a hat” process. Scientists use a variety of methods to select individuals at random
Types of Statistics Methods of…collectingorganizingpresenting and analyzingdata Science of…making inferences about a population, based onsample information. Descriptive Inferential
Identify the following… Descriptive Inferential A. A Gallup poll found that 83% of the people in a survey knew which country won the gold medal in Men’s Hockey in 2002. B. The accounting department of a firm will select a sample of invoices to check for accuracy of all the invoices of the company. C. Wine tasters sip a few drops of wine to make a decision with respect to all the wine waiting to be released for sale.
Identify the following… Descriptive Inferential A. A Gallup poll found that 83% of the people in a survey knew which country won the gold medal in Men’s Hockey in 2002. B. The accounting department of a firm will select a sample of invoices to check for accuracy of all the invoices of the company. C. Wine tasters sip a few drops of wine to make a decision with respect to all the wine waiting to be released for sale.
The Method of Experimentation We start off with particular observationsfrom the real world and draw conclusionsabout thegeneral patterns in the real world! 1. Definethe experimental goal or a working hypothesis 2. Design an experiment 3. Collect data 4. Estimate the values/relations 5.Draw inferences 6. Predict and prepare policy analysis
A Study A study was undertaken to estimate the average height of penguins in Antarctica. Let’s review the steps they would take to prepare the estimate.
What Information do we need? the POPULATION
A population is acollection of all possibleindividuals, objects,or measurements of interest
From POPULATION Take a …which are deemed to be representative of the Sample POPULATION Say, 101 What we now need is…
Take a Measurement for each one in the sample Record 101 Sample Raw Data
? Goal What Now Displaying Data Results …to put the data into a readable and understandable format!
More on these in chapter 2… Two methods that can be used to ‘see’ what the data conveys are Tables and Graphs/Charts
Tables e.g. 101 More on these in chapter 2… … are an efficient method of displaying data and depicting data accurately.
Pie Line Bar Scatter Histogram More on these in chapter 2… Charts Graphs
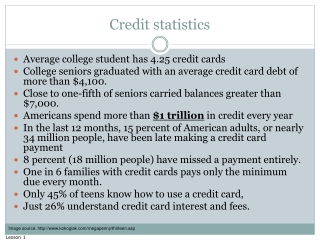
Why take a sample instead of studying every member of the population? Costs of surveying the entire population may be too large or prohibitive Destruction of elements during investigation Accuracy of results
Why Study Statistics? • Data are everywhere • Statistical techniques are used to make many decision that affect our lives • No matter what your future line of work, you will make decisions that involve data. An understanding of statistical methods will help you make these decisions more effectively.
Types of Data
Types of Data A Variable a characteristic of a population orsample that is of interest to us
Quantitative Qualitative Types of Data Variables Categorical Observations Numerical Observations
Variables Qualitative – or Attribute Country of Birth U.K. Germany Taiwan China India Japan Russia Eye Colour Blue Brown Hazel Green Red GenderMale Female
Variables Quantitative – Numeric Minutes to end of Class 55 45 30 5 0 Number of Two-Door Garages in a Street 10 20 30 40 ... Number of Satisfied Maple Leafs Fans 0 20 30 40 … Number of Children in a Family 1 2 3 4 …
Quantitative Numerical Observations Variables … can be classified as either Discrete or Continuous Characteristics … can only assumecertain values and there are usually “gaps”between values Discrete e.g. - Number of bedrooms in a house - Number of hammers sold (1,2,3,…etc)
Quantitative Numerical Observations Variables … can be classified as either Discrete or Continuous Characteristics … can assumeanyvaluewithin a specified range! Continuous e.g. - Pressure in a tire - Weight of a pork chop - Height of students in a class
Quantitative Numerical Observations Qualitative Categorical Observations Summary of Types of Variables Data Discrete Continuous (number of children) (time used for an exam)
Levels of Measurement
Levels of Measurement Nominal Ordinal Interval Ratio
M & Ms Nominal Levels of Measurement Data can only be classified into categories or counted and cannotbe arranged in any particular order Example Candy Category: By Colour only Classification: (No natural order)
Nominal Levels of Measurement M & Ms Example Mutually Exclusive: …where an individual, object, or measurement is included in ONLY ONE CATEGORY Exhaustive: …where each individual, object, or measurement MUST APPEAR in one of the categories
Ordinal Levels of Measurement …involves data arranged in some order, but the differencesbetween data valuescannot be determined or are meaningless! Example During a taste test of 4 soft drinks: Mello Yellowas ranked number……..…. 1. Sprite number……………………………. 2. Seven Up number..…………………..…... 3. Orange Crushnumber ….……………….4.
Interval Temperature on the Celsius scale. Levels of Measurement …similar to the Ordinal Level, with the additional property that meaningful amounts of differences between data values can be determined. There is no natural zero point Example
Monthly income of surgeons Ratio Distance travelled by manufacturer’s representatives per month Levels of Measurement …the Interval Levelwithan inherent zero starting point. Differences and ratios are meaningful for this level of measurement. Examples
Caution Figures don’t lie. Liars figure!