Download
1 / 50
500 likes | 508 Views
Learn how to analyze data and conduct root cause analysis to improve outcomes for children with disabilities. Discover tools and techniques to identify patterns, compare data, and make meaningful improvements. Presented by Mary Corey, Coordinator of Special Education Data at the Missouri Department of Elementary and Secondary Education.

E N D
Using Data to Drive Improved Results for Children with Disabilities Facilitated by Mary Corey Coordinator, Special Education Data Missouri Department of Elementary and Secondary Education
OSEP Disclaimer 2019 OSEP Leadership Conference DISCLAIMER: The contents of this presentation were developed by the presenters for the 2019 OSEP Leadership Conference. However, these contents do not necessarily represent the policy of the Department of Education, and you should not assume endorsement by the Federal Government. (Authority: 20 U.S.C. 1221e-3 and 3474)
Agenda • Oklahoma Part B: Trained LEAs to analyze data and conduct root cause analysis for local improvement • Department of Defense, Army (Educational and Developmental Intervention Services) Part C: Conducted system-level analyses to improve quality and quantity of early childhood child and family outcome data across all units • Kansas Part B: Facilitated the analysis of a specific LEA’s discipline data to reduce disproportionate suspensions and expulsions
Oklahoma: Empowering LEAs to Use Data to Improve Outcomes Ginger Elliott-Teague, PhD Director of Data Analysis, Special Education Oklahoma State Department of Education
Goal: Build LEA capacity to use data to drive local improvements
Training & Tools to See the Evidence • User manuals • Webinars and in-person training • Biannual child count/end of year seminars • Data retreat • Statistical tools • How to identify patterns within and across categories and variables • Center, shape and spread • Comparing means • Cross-tabs • Scatterplots
Identifying Outliers • Using center and spread together to understand shape and identify outliers
Three Approaches to Comparing Data • Depends on the types of variables/factors you have • Categorical vs numerical • How many attributes exist in each factor? • Both categorical and/or few attributes: use cross-tabulation • Both numerical and/or many attributes: use scatterplots • Numerical and categorical: compare means across groups • Or use regrouping to build cross-tabs
Inference: What does my evidence mean? Scatterplot: Daily Comparison of Hours of Sleep to Steps Counted • Patterns of various kinds • Outliers • Positive and negative lines • Bimodal or gapped data • Uniform versus random • Measuring pattern strength • Statistical techniques
Training to Link Data to Improvement • Data Retreat • Root-cause analysis • Self-assessments • Improvement plans • What is the relationship between the attendance rates of students who do not graduate on time and/or have dropped out of school? • Consider whether students with disabilities differ from those without, whether attendance is an issue, whether students were absent when younger, etc. • What have you learned? • What will you do about it? How does your district analyze suspension data for students with and without disabilities? How do you identify students at risk for not graduating on time and/or dropping out? What have you learned? What will you do about it? WHY? Why? Why? WHY? WHY???
Action: Impact on Student Outcomes • No concrete evidence yet linking participation in the data retreat or high quality completion of self-assessments to student outcomes • Anticipated outcomes: • LEAs will learn through practice how to devise program improvements that are rooted in data. • Program improvements will lead to better student outcomes.
DoD Army EDIS:Child & Family Outcomes Data: Inspiring changes that might have otherwise not occurred Naomi Younggren, PhD Part C/CSPD Coordinator DoD Army EDIS
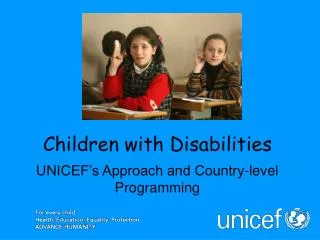
Child & Family Outcomes Three child outcomes • Children have positive social emotional skills • Children acquire and use knowledge and skills • Children use appropriate behaviors to meet their needs FAMILY OUTCOMES - Percentage of families reporting that EI helped their family: • Know their rights • Effectively communicate their child's needs • Help their child develop and learn
Child & Family Outcomes Inspired Changes • Embedding the child outcomes measurement process into the IFSP • Advancing local level data awareness, analysis, and application • Partnering with families to measure child outcomes
Celebrate Success ANDContinue tracking and efforts to further increase return rates!
Be mindful of slippage Examine program data in light of national data IDEA Part C and Part B Section 619 National Child Outcomes Results for 2016-17 (Webinar October 9, 2018 Presenters: Christina Kasprzak and Cornelia Taylor)
Slide 19 Data Patterns for COS Ratings: What to Expect and What to Question Taylor, C., & Tunzi, D. (2018). Data patterns for COS ratings: What to expect and what to question. Menlo Park, CA: SRI International. http://ectacenter.org/~pdfs/eco/pattern_checking_for_cos_ratings.pdf
Slide 20 • Are there missing data? • Are there obvious questions about data entry? • Do the ratings match the children – you know the children?
4. Are ratings across outcomes related as expected? 5. Do the changes in entry to exit show an expected distribution? 6. Is the distribution of entry/exit ratings as expected? 7. Do the entry to exit means increase? Slide 21
Slide 23 Younggren, N., Barton, L., Jackson, B., Swett, J. & Smyth, C. (2017). Child Outcomes Summary-Team Collaboration (COS-TC) Quality Practices: Checklist and Descriptions. Retrieved from http://ectacenter.org/eco/pages/costeam.asp
Child and Family Outcome InspiredPositive Change o https://www.youtube.com/watch?v=j5pdmyTs4co
Data do not have to be difficult to be useful, even simple analysis can help influence positive change.
Kansas: Equity, Inclusion, and Opportunity: Addressing Success Gaps in Our Districts Laura Jurgensen, Assistant Director Special Education and Title Services Kansas State Department of Education
The Success Gaps Process • Use data to identify groups of students who experience educational “success gaps” in areas such as attendance, graduation, test scores, discipline, and class placement; • Build a teamof educators, parents, students as appropriate, and community members focused on the groups experiencing the gaps; school or district leaders capable of implementing change; and data experts; • Use local data to identify factors that promote or–if absent–detract from equity, inclusion, and opportunity for all students; • Create action plans to address identified negative factors; and • Implement the action plans over time, with structures in place to maintain a focus on data and the groups affected by success gaps.
Two tools from the IDEA Data Center (IDC) help you identify and address practices by finding the factors contributing to the success gap.
Success Gaps Toolkit Includes— • Guidelines (instructions) for using the Success Gaps materials • Meeting agendas for a series of meetings and presentation shells for each meeting • Some materials for pre-reading • Two videos, one to invite participants to be part of the success gaps work and one to introduce success gaps during the first meeting • Sample action plan formats and meeting evaluation formats • Written stories or examples of work in other states or districts
Phase One IDENTIFY SUCCESS GAPS
What is a success gap? • A gap in educational outcomes between different groups of students • Achievement • Identification for special education • Suspension rates • Course-taking • Graduation rates • Attendance
Kansas Identifies a Success Gap Data from 2016–17 school year
Phase Two BUILD A TEAM
Kansas City Builds a Team Considered the demographics of the student population as well as staff demographics. Kansas City, KS Staff: 28.5% Black (certified and classified) 30% Administrators Black Kansas City, KS Students: • 49.76% Hispanic • 27.37 % African American • 12.53% White • 10.34% other 25% of the Success Gaps team members from KCKPS were African American
Phase Three IDENTIFY FACTORS CONTRIBUTING TO THE SUCCESS GAP
Equity, Inclusion, and Opportunity Can Lessen Success Gaps Between Groups of Students
Identifying the Factors Contributing to Kansas City’s Success Gap • Six meeting dates from February to April, two hours in length • First meeting, set purpose and agreed upon the focus of the work. • Three meetings, completed self-assessment (rubric) • Prioritized elements and formed groups • Each of the two groups met to develop plans • Last meeting, shared plans with whole group
Identifying the Factors Contributing to Kansas City’s Success Gap • Meeting One: Establishing Purpose
Meeting Five: Prioritizing Need • Each member given 100% to split among the indicators however they chose • The top two were • Indicator 1: Data-Based Decision-Making • Indicator 2a: Culturally responsive instructional interventions and teaching strategies are used throughout the district
Phase Four CREATE ACTION PLAN
Data-based Decision-Making • Emerged as most pressing and focused on as a corrective action plan. • Some aspects of the Cultural Responsiveness plan are being implemented.
Phase Five IMPLEMENT ACTION PLAN
Implementation in Kansas City, Kansas • Action plan implemented districtwide • KSDE monitored implementation in 15 schools based on discipline data from the 2016-17 school year for black students with disabilities • 3 of 4 comprehensive high schools • 6 of 8 middle schools • 6 of 30 elementary schools
Implementation in Kansas City, Kansas • KSDE staff met with a building-level leadership team in each building monitored to observe discipline data analysis • KSDE also observed professional development • District leadership received guidance and feedback from KSDE multiple times per month in the support of building-level implementation • KSDE completed its oversite in December 2018
Reflecting on the Process • Preferred to see the district implement its action plans independently. • However, KSDE used one of the action plans as a corrective plan. • Success Gaps is not intended to be a monitoring tool. • KCK not identified under Indicator 4B for the following school year. Significant improvements made in the number of suspensions and expulsions of black students with disabilities.
For More Information Visit the IDC website http://ideadata.org/ Contact Laura at ljurgensen@ksde.org
OSEP Disclaimer 2019 OSEP Leadership Conference DISCLAIMER: The contents of this presentation were developed by the presenters for the 2019 OSEP Leadership Conference. However, these contents do not necessarily represent the policy of the Department of Education, and you should not assume endorsement by the Federal Government. (Authority: 20 U.S.C. 1221e-3 and 3474)