Download
1 / 30
310 likes | 328 Views
Discover, Devise and Deploy. Plotting a plan with basic process improvement tools in a lab setting. Charles E. Holman. About Me… (let’s keep it to a minimum Chuck!). I am an active duty Senior Master Sergeant in the United States Air Force Served 21 years this month!

E N D
Discover, Devise and Deploy Plotting a plan with basic process improvement tools in a lab setting Charles E. Holman
About Me… (let’s keep it to a minimum Chuck!) • I am an active duty Senior Master Sergeant in the United States Air Force • Served 21 years this month! • Joined right out of High School and never looked back • Traveled all over the world • Family • Wife – Oxana • Boys – Eddie and Max • Precision Measurement Equipment Laboratory (PMEL) Flight Chief • Lead/manage technicians in the calibration, repair, and maintenance of over 10.5K items of test, measurement and diagnostic equipment (TMDE) • Maintain a quality program ensuring all Test, Measurement, and Diagnostic Equipment (TMDE) is safe, accurate, reliable, and traceable for a customer base of over 155 work centers. • ASQ Measurement Quality Division Past-Chair • Led member leader team in the management of 4.5K member base • Certified Calibration Technician steward
Overview • Where the story begins…? • Improvement Process • Capability Analysis • The Change Process • Ready for Implementation • Culture Change • Summary
Where the story begins… • A “worst case” scenario for both workers and management • New manager comes in and business operations seems a bit off • Current workers “circle the wagons” • Management is making change just to look good • Are we going to lose our jobs now? • Corporate is closing us down • It all begins (and ends) with the customer • Customer feedback • Customer comment cards
Where the story begins…(Cont) • Issues Identified • The PMEL production control section’s customer support satisfaction was poor, and customer response to requests was slow • Unscheduled and unpredictable customer demand frequently caused long wait times during check-in or pick-up of TMDE • The process of checking-in TMDE was time consuming and led to traffic bottlenecks in the waiting area • Overdue TMDE, or TMDE that exceeded calibration intervals, was not turned in to the PMEL, and equipment pick-up by customers wasn’t timely
Improvement Process • Continuous Process Improvement Team (CPI) • Team make-up • Those who are close to the process • Diversity is key! • Champion Kick-off • Schedule a “Champion Kick-off” meeting with CPI Team • Shows leadership/management support for change • Establishes/reinforces need for change • Aides team and workforce buy-in • Formalize with a Project Charter
Improvement Process (Cont) • Project Charter • Describe Problem/Project Description • PMEL Production Control customer support satisfaction is poor and customer response to PMEL requests is slow. Unscheduled and unpredictable customer demand frequently causes long wait times to check-in or pick-up TMDE. The process of checking in TMDE is time-consuming and leads to bottlenecks. Overdue TMDE is not being turned into PMEL and equipment is not picked up by the customer in a timely manner. • Should answer questions: • What is happening? • Who is it happening to? • Where is it happening? • When is it happening?
Improvement Process (Cont) • Project Scope • Define the area the improvement process is limited to • Aids in protection against “Scope Creep” that may redirect sources over time to areas not the focus of improvement • Provides specific policy and physical boundaries • Limited to the Production Control Section as outlined in standard operating procedure 10.4.5 • Project Objectives and Goals • Reduce PMEL Customer Wait Time (CWT) while increasing TMDE throughput in scheduling (Production Control) • Goal – Reduce CWT by 75% • Reduce the amount of TMDE items that overdue for calibration • Goal – Reduce overdue calibrations by 50%
Improvement Process (Cont) • Identify Business Needs • Customer Impact: • Customers have severe waits times do to the lack of assigned times for drop-off. Furthermore, the summation of all variables, internal and external, has caused for increases in times in status. This means TMDE is not going out to external customers in a reasonable time. • Shareholder Impact: • Reduce operational expenses by reducing variability in the Production Control Section while, decreasing inventories of overdue calibration, due calibration, scheduled maintenance, and unscheduled maintenance of TMDE. Overall, identify and eliminate all unnecessary constraints in an effort to exceed customer expectations and mission demands. • Employee Impact: • Production Control Section employees have no standard of work to perform the tasks required as outlined in standard operating procedure 10.4.5. The lack of written/published processes has led to methods by reactionary interpretations of local policies. This has led to a hostile work environment with low job satisfaction and poor quality performance from Production Control Technicians. Furthermore, no formal training in customer service has led to employee/customer confrontations that has been elevated to superiors for resolution.
Capability Analysis • Process improvement tool used to determine whether a process, or system, is stable and/or requires improvement • Requires data • Best when displayed as a Run Chart (Visual Management) • Formula: • Overdue TMDE Data collected over ~75 days
Capability Analysis (Cont) • Using formula and Run Chart: • = ~-0.49 (Cpk standard is 1.3 or greater)
Capability Analysis (Cont) • CWT Data collected over ~75 days • Using formula and Run Chart: • = ~-0.41 (Cpk standard is 1.3 or greater)
Capability Analysis (Cont) • Analysis: • Overdue TMDE – With a Cpk of ~-0-49, this is indicative of a process that requires much needed improvement • CWT – With a Cpk of ~-0.41, this is also indicative of a process that requires much needed improvement • Using this tool may seem complex however it actually is quite easy use • Value comes from using data generated during normal everyday operations and comparing against a known standard (1.3 or greater) while displaying graphically
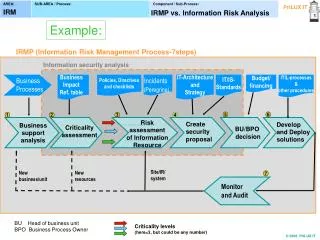
The Change Process • Armed with data, what’s next? • In order to begin the change process, the CPI (continuous process improvement) team needs to see what the process looks like • Enter the Suppliers, Inputs, Process, Outputs, and Customers (SIPOC) diagram • Helps define the scope and major elements of a process • Helps target those stakeholders necessary to enact change • Puts forth an exercise for front line supervisors and workers to describe processes as they are executed • Helps develop a formalized flow chart
The Change Process (Cont) • With the SIPOC completed and project scoped, it’s time to walk the process • Enter the Flow Chart • Allows front line supervisors and workers to see the steps executed within a process • Part of visual management • Helps create a culture of change when current process reveals a lot of re-work or duplication of effort
The Change Process (Cont) • We now have the data, SIPOC, Project Scope, and Flow Chart…it is time to find out where the problems reside • Enter the Ishikawa, or Fishbone diagram
The Change Process (Cont) • We now have the data, SIPOC, Project Scope, and Flow Chart…it is time to find out where the problems reside • Enter the Ishikawa, or Fishbone diagram
The Change Process (Cont) • Effects for Action – Where to begin? • With all things being considered, the CPI team has uncovered potential root causes for processes yielding Overdue TMDE and excessive CWT • Using the Fishbone Diagrams, which causes contributed most to the poor process effects? • Enter the $100 exercise • While not a traditional quality control or process improvement tool, this exercise leverages the “gut” instinct of CPI team members • Each member of the CPI team is given $100 and can distribute as they see fit as to where they feel the effect to focus on would get the most “bang for the buck” • All members submit anonymously • Display and format results visually…recommend a Pareto Chart
The Change Process (Cont) • Pareto Chart used in conjunction with “$100” exercise
The Change Process (Cont) • Pareto Chart used in conjunction with “$100” exercise
The Change Process (Cont) • Analysis • CWT • The result of the analysis has shown that having no published schedules was the most probable cause for excessive CWT. • The next major contributing factor is no structured time-frames for OWCs to drop-off and pick-up their equipment. • Finally, the last contributing factor for this Effect is the absence of formal training for Production Control technicians. • After review of the analysis, the team identified that having no structured time-frames for customers to drop-off and pick-up their equipment could also be a part of having no published schedules. It was decided to incorporate structured time-frames for customers when/if a schedule were to be created. • The final analysis for the Effect of CWT is most probably the cause of no published schedules with appointed time-frames for customers to drop-off and pick-up equipment.
The Change Process (Cont) • Analysis • Overdue TMDE • The result of the analysis has shown that having no established processes for communication with customers was the most probable cause for TMDE that becomes overdue and remains in this status for unknown periods of time. • The next major contributing factor is no written job instructions for Production Control technicians to follow when items are identified as Overdue. • The next identified contributing factors are the lack of adherence with standard operating procedure 10.4.5 and the overall poor communication with customers. • After review of the analysis, the team identified that overall poor communication with customers was a direct result of having no established processes for communication with customers. • Additionally, revealed that having no written job instructions for Production Control technicians as a whole can be grouped together with having no established processes for communication with OWCs. • The final analysis for the Effect of Overdue TMDE is most probably the cause of lack of standardized processes for notifying customers when their equipment is overdue
Ready for Implementation • Implement corrective actions • CWT • Develop and publish schedules with appointed time-frames for customers to drop-off and pick-up equipment • Goal – Reduce CWT by 75% • Overdue TMDE • Develop and utilize standardize processes for notifying customers when their equipment is overdue • Goal – Reduce Overdue TMDE by 50%
Ready for Implementation (Cont) • Monitor and Assess corrective actions • Specify time period • Compare against established goal/baseline • Do not be afraid to fail or call “the baby ugly” • If the corrective actions are not working or data shows a continued negative trend, go back and reassess corrective actions • Add failed corrective actions to a “Lessons Learned” database Note – Ensure to give corrective actions time to work!
Ready for Implementation (Cont) • Monitor and Assess corrective actions • Overdue TMDE • N (# of Days) = 13
Ready for Implementation (Cont) • Monitor and Assess corrective actions • CWT • N (# of Days) = 13
Ready for Implementation (Cont) • Once the corrective actions are determined to be effective… STANDARDIZE, STANDARDIZE, STANDARDIZE!!! (Make it part of everyday process via standard operating procedures)
Culture Change • A big part of “change” is changing the culture • Create a coalition for change • Create a need for change • Get leadership “buy-in” • Piece together change teams using personnel closest to the process • Guide them to solutions • Empower groups to make decisions • Encourage an environment of trust • Make a big deal out of small victories…aim for easy wins at first • Not as easy as it seems but, still a start to improving processes