Download

1 / 37
420 likes | 532 Views
Chemical Engineering Thermodynamics. Fall 2004 Dr. Holly J Moore. Physical and Chemical Equilibrium for Chemical Engineers. Chapter 1 Introduction to Equilibrium. Why Study Equilibrium?. The four basic tools used by chemical and environmental engineers are: Material Balances

E N D
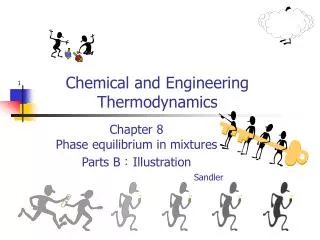
Chemical Engineering Thermodynamics Fall 2004 Dr. Holly J Moore
Physical and Chemical Equilibrium for Chemical Engineers Chapter 1 Introduction to Equilibrium
Why Study Equilibrium? • The four basic tools used by chemical and environmental engineers are: • Material Balances • Energy Balances • Equilibrium Relationships • Phase • Chemical • Rate Equations
ChillerCondenses most of the ammonia Consider the Synthesis of Ammonia Recycled Product Ammonia and unreacted feed Bleed Stream N2 + 3 H2⇋ 2NH3 3 moles H2 1 mole N2 Reactor partially converts H2 and N2 to NH3 Material Balance Energy Balance Equilibrium Relationships Reaction Rates Separator Liquid Ammonia ~15% conversion
Why Study Equilibrium? • The four basic tools used by chemical and environmental engineers are: • Material Balances • Energy Balances • Equilibrium Relationships • Phase • Chemical • Rate Equations This course is about equilibrium !!
Equilibrium is like a brick wall between where we are and where we want to go Equilibrium Where we are Where we want to go
To know the dimensions of our problem, we must know where the equilibrium limits are. This course is about that
Equilibrium • A system is at equilibrium if there is no change with time in any of the measurable properties • Some systems come to equilibrium quickly • Combustion is an example
Equilibrium • A system is at equilibrium if there is no change with time in any of the measurable properties • Some systems come to equilibrium slowly • Rust is an example
Equilibrium • As a practical matter, many of the systems we are interested in as chemical engineers can be assumed to be at equilibrium with very little error
Being at equilibrium does not mean the system is static Liquid water and water vapor are at equilibrium when just as many molecules evaporate as condense
Equilibrium is not always desirable Diamonds are not the equilibrium form of carbon
People aren’t at Equilibrium Carbon dioxide gas Water Solids
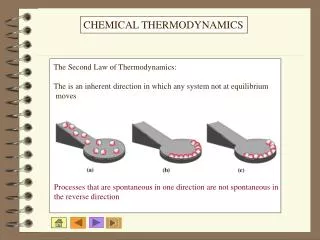
Types of Equilibrium • Stable • Metastable • Unstable • Neutral
Types of Equilibrium • Stable • Metastable • Unstable • Neutral If ball is moved from its stable position, it will roll right back
Types of Equilibrium • Stable • Metastable • Unstable • Neutral If ball is moved slightly from its stable position, it will roll right back. However, a moderate displacement will cause the ball to roll down the other side of the hill.
Types of Equilibrium • Stable • Metastable • Unstable • Neutral If ball is moved from its unstable position, it will roll off the hill, until it finds a stable point
Types of Equilibrium • Stable • Metastable • Unstable • Neutral If ball is moved from its stable position, it will remain at the new position
Gibbs Free Energy • All natural systems try to achieve a minimum Gibbs Free Energy • At equilibrium: G = H - TS g = h - Ts dGsys = 0
Units, Conversions and Notation • Both SI and English are used • Extensive properties depend on the size of the system • U, V etc • Usually repesented with capital letters • m is an obvious exception • Intensive properties are independent of the system size • h, v, s, T, P • Usually represented with lower case letters • T and P are obvious exceptions
Mass Fractions and Mole Fractions • xi indicates either the mass or mole fraction in a liquid • yi indicates either the mass or mole fraction in a gas This is obviously a source of confusion – before performing any calculations be sure you understand whether mass fraction or mole fraction is appropriate. Although these parameters are dimensionless, dimensions of kg/kg or mole/mole are sometimes added for clarity
PPM and PPB • Parts Per Million • Usually based on volume or mole for gases • Usually based on mass for liquids • mg/kg • Part Per Billion • Uses the same convention • mg/kg
Reality, Equations and Tables • It is difficult and expensive to measure physical properties. • Physical property tables are created by: • Finding equations that reproduce experimental data • Using those equations to interpolate or extrapolate to the desired conditions • Much of this course is devoted to finding those equations
Phases and Phase Diagrams An equilibrium phase is one that has a completely uniform composition throughout.
Gases • All gases form one phase • They are completely “miscible”
Liquids • Liquids can form multiple phases • Oil and water Oil Water
Solids • Homogeneous solids are single phases • Heterogeneous solids are multiple phases • Salt and Pepper are two different phases, even when they are mixed
Multiphase solids • Sometimes it’s hard to tell how many solid phases are present • Steel and cast iron consist of two phases • Ferrite and cementite • Copper and nickel alloys consist of one phase • They are solid solutions
Different phases may be stable at different conditions • Carbon • Diamond • Graphite • Buckyballs
Iron • Molten iron solidifies as a body centered cubic crystal (BCC) called d-ferrite • As it cools, it changed to a face centered cubic crystal (FCC) called austenite • It changes phase again as it cools further, back to BCC, and is called a-ferrite
d, ferrite 1600 C g, austenite 1400 C a, ferrite Cementite (Fe3C 1200 C 1000 C 800 C 600 C 400 C Fe 1% C 2% C 3% C 4% C 5% C 6% C 6.70% C Iron-Iron Carbide Phase Diagram1 atm
Water • You are probably more familiar with the phase diagram of water – or at least you think you are
Figure 1.8, page 13 Values at low pressures are not visible when the data is plotted on the arithmetic scale. They become easier to read on a logarithmic scale
The appearance of the phase diagram changes dramatically when you change the temperature and pressure range
Water Phase Diagram at very high pressures – Note there are 7 separate solid phases!!
Water • Most of the time we will only use the water phase diagram at moderate temperatures and pressures • However, it is useful to remember that you can’t just extrapolate water’s behavior to extreme conditions
Homework • For Friday… • Problems 1.3 and 1.5 • If you don’t have a text yet, be sure to copy down the homework problems before you go today!!