Download
1 / 26
280 likes | 464 Views
New UEF Emission Factors for SMC Production and Compression Molding . David Lipiro Environmental Compliance & Risk Management dlipiro@ecrminc.com. ECRM. Terminology. SMC = Sheet Molding Compound BMC = Bulk Molding Compound LCM = Liquid Composites Molding

E N D
New UEF Emission Factors for SMC Production and Compression Molding David Lipiro Environmental Compliance & Risk Management dlipiro@ecrminc.com ECRM
Terminology • SMC = Sheet Molding Compound • BMC = Bulk Molding Compound • LCM = Liquid Composites Molding • UEF = ANSI/ACMA/ICPA UEF-1-2009, Estimating Emission Factors from Open Molding and Other Composite Processes (Current Version)
Factors for VOC Emissions • Compounding (in UEF) – from SMC machines – based on ECRM study • Compression molding (proposed) – SMC, BMC, LCM – based on EECS studies (R. Haberlein)
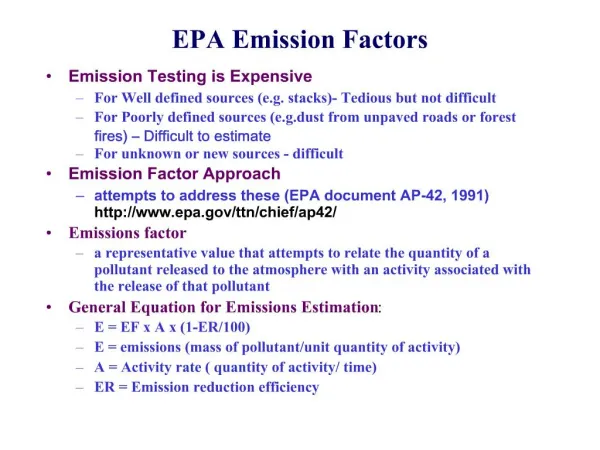
Estimating Emissions • Emission Factor = ratio • Lb emitted/lb compound used = E/C = 0.002 • Lb emitted/lb styrene used = E/S = 0.02 • Equivalent Emission Models • E = 0.002*C • E = 0.02*S • Simplest model constant factor • Derive models and factors from test data
Compounding Emission Model • Theory • Lab weight loss experiments at MFG Research – C. Piper • Evaluate recent VOC emission tests of 7 SMC machines
Theory • Areas where paste is not covered by carrier film = window to environment • Exposed area A ft2 is constant for each SMC machine • Simplest model:E lb/hr = kA, k = constant Upper Lower
Styrene Content? • Affects skinover? • Expected to be important based on UEF for open molding
Line Speed? • Skinover effect at longer travel times lower emissions at lower linespeeds? • Induced air velocity as paste moves under air impact depends on vent airflow patterns?
MFG Lab Tests • Wt loss by analytical balance + datalogger, 10 readings per second, 6-8 reps • Constant sample pan area = 0.16379 ft2 • Range of S.G. and styrene % in pastes used • “Wind tunnel” w anemometer – simulate motion-induced airflow • Run times cover realistic line travel times - simulate skinover
Conclusions/Predictions • Not much skinover effect – most weight loss curves linear or near • Styrene content will probably have little impact on emissions • Line speed probably won’t effect emissions • Emissions will vary with open area, temperature and air velocity - only area practical for permitting
Field Verification • Method 24 TTE emission tests • 7 uncontrolled machines – 24”, 48”, 60” • Wide range of open areas, styrene contents, linespeeds • No temperature control at doctor boxes • Doctor boxes open to nearly closed
Field Data Analysis • Regression: Emissions vs Predictor • Predictors compared: • Area • Styrene throughput (traditional) • SMC throughput
Compounding Emission Model in UEF • Er = 0.1457*A-0.1454, where: • Er = emission rate of SMC machine, lb/hr • A = open wet area of machine (including uncovered doctor box area), ft2 • Emissions = Er * t (hrs) • Permitting: E is constant when paste on line - throughput irrelevant
Compression Molding • SMC, BMC, LCM • Emissions from charge prep only - Once press closes, negligible emissions • EECS Study: Charge prep emissions measured in Method 204 TTE
SMC Compression Molding • Two “traditional” EFs proposed based on test data • Which is best predictor? • What are underlying models?
EFs Compared • E/C = 0.002 is poorer predictor(R2=0.74, 10% total overestimate) • E/S = 0.0152 is better predictor (R2=0.81, 5% total overestimate), same form as published AP-42 factor • UEF: E lb = 1.5% styrene lb run vs 2% AP-42 factor
BMC and LCM • UEF: BMC Molding Emissions = 1.15% of styrene in compoundmolded • UEF: LCM EF, lb styrene / lb paste molded = • Spread prep: 0.0072*S% + 0.008 • Pour prep: 0.0022*S% + 0.008 • LCM Emissions = EF * lb paste molded
Why Use These Factors? • Best available methods to estimate emissions w/o site testing • Most credible factors available – adopted into UEF by transparent ANSI consensus process involving industry and state/fed regulators
Thank you for attending Questions ECRM