Download
1 / 1
10 likes | 145 Views
Comparative Analysis of Impurities in Beach Sand Using EPR. Melvin C. Figueroa Science Teacher, New River Middle School Fort Lauderdale, FL. Marcia R. Young Science Teacher, Gunn Jr. High Arlington, TX. Graph 4. Graph 1. Questions For Research

E N D
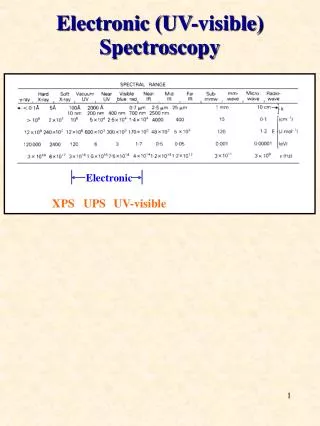
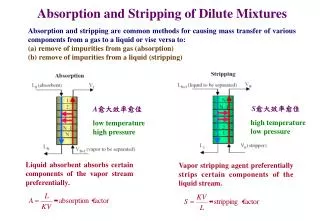
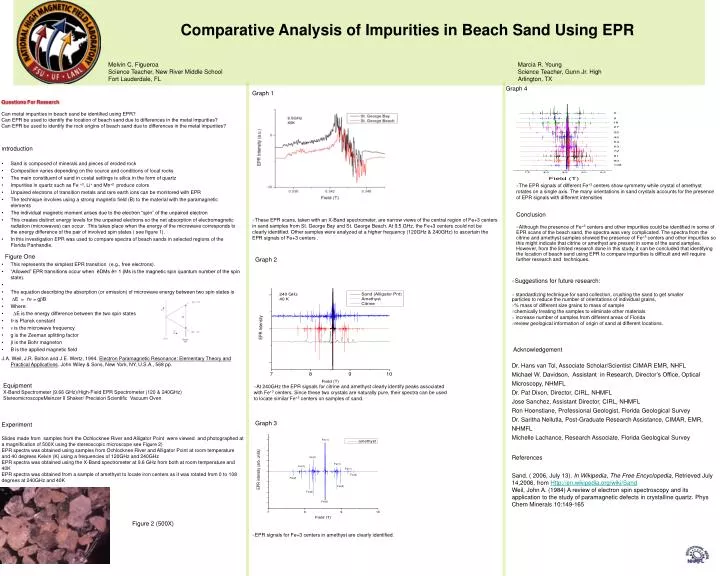
Comparative Analysis of Impurities in Beach Sand Using EPR Melvin C. Figueroa Science Teacher, New River Middle School Fort Lauderdale, FL Marcia R. Young Science Teacher, Gunn Jr. High Arlington, TX Graph 4 Graph 1 Questions For Research Can metal impurities in beach sand be identified using EPR? Can EPR be used to identify the location of beach sand due to differences in the metal impurities? Can EPR be used to identify the rock origins of beach sand due to differences in the metal impurities? Introduction • Sand is composed of minerals and pieces of eroded rock • Composition varies depending on the source and conditions of local rocks • The main constituent of sand in costal settings is silica in the form of quartz • Impurities in quartz such as Fe +3, Li+ and Mn+2 produce colors • Unpaired electrons of transition metals and rare earth ions can be monitored with EPR • The technique involves using a strong magnetic field (B) to the material with the paramagnetic elements • The individual magnetic moment arises due to the electron “spin” of the unpaired electron • This creates distinct energy levels for the unpaired electrons so the net absorption of electromagnetic radiation (microwaves) can occur. This takes place when the energy of the microwave corresponds to the energy difference of the pair of involved spin states ( see figure 1). • In this investigation EPR was used to compare spectra of beach sands in selected regions of the Florida Panhandle. • The EPR signals of different Fe+3 centers show symmetry while crystal of amethyst rotates on a single axis. The many orientations in sand crystals accounts for the presence of EPR signals with different intensities Conclusion • These EPR scans, taken with an X-Band spectrometer, are narrow views of the central region of Fe+3 centers in sand samples from St. George Bay and St. George Beach. At 9.5 GHz, the Fe+3 centers could not be clearly identified. Other samples were analyzed at a higher frequency (120GHz & 240GHz) to ascertain the EPR signals of Fe+3 centers . • Although the presence of Fe+3 centers and other impurities could be identified in some of EPR scans of the beach sand, the spectra was very complicated. The spectra from the citrine and amethyst samples showed the presence of Fe+3 centers and other impurities so this might indicate that citrine or amethyst are present in some of the sand samples. However, from the limited research done in this study, it can be concluded that identifying the location of beach sand using EPR to compare impurities is difficult and will require further research and techniques. Figure One • This represents the simplest EPR transition (e.g., free electrons). • “Allowed” EPR transitions occur when êDMs ê= 1 (Ms is the magnetic spin quantum number of the spin state). • The equation describing the absorption (or emission) of microwave energy between two spin states is • ∆E = hν = gβB • Where: • ∆E is the energy difference between the two spin states • h is Planck constant • νis the microwave frequency • g is the Zeeman splitting factor • β is the Bohr magneton • B is the applied magnetic field J.A. Weil, J.R. Bolton and J.E. Wertz, 1994. Electron Paramagnetic Resonance: Elementary Theory and Practical Applications. John Wiley & Sons, New York, NY, U.S.A., 568 pp. Graph 2 • Suggestions for future research: • standardizing technique for sand collection, crushing the sand to get smaller particles to reduce the number of orientations of individual grains, • % mass of different size grains to mass of sample • chemically treating the samples to eliminate other materials • increase number of samples from different areas of Florida • review geological information of origin of sand at different locations. Acknowledgement Dr. Hans van Tol, Associate Scholar/Scientist CIMAR EMR, NHFL Michael W. Davidson, Assistant in Research, Director’s Office, Optical Microscopy, NHMFL Dr. Pat Dixon, Director, CIRL, NHMFL Jose Sanchez, Assistant Director, CIRL, NHMFL Ron Hoenstiane, Professional Geologist, Florida Geological Survey Dr. Saritha Nellutla, Post-Graduate Research Assistance, CIMAR, EMR, NHMFL Michelle Lachance, Research Associate, Florida Geological Survey Equipment X-Band Spectrometer (9.66 GHz)/High-Field EPR Spectrometer (120 & 240GHz) StereomicroscopeMeinzer II Shaker/ Precision Scientific Vacuum Oven • At 240GHz the EPR signals for citrine and amethyst clearly identify peaks associated with Fe+3 centers. Since these two crystals are naturally pure, their spectra can be used to locate similar Fe+3 centers on samples of sand. Graph 3 Experiment Slides made from samples from the Ochlocknee River and Alligator Point were viewed and photographed at a magnification of 500X using the stereoscopic microscope see Figure 2) EPR spectra was obtained using samples from Ochlocknee River and Alligator Point at room temperature and 40 degrees Kelvin (K) using a frequencies of 120GHz and 240GHz EPR spectra was obtained using the X-Band spectrometer at 9.6 GHz from both at room temperature and 40K EPR spectra was obtained from a sample of amethyst to locate iron centers as it was rotated from 0 to 108 degrees at 240GHz and 40K References • Sand. ( 2006, July 13). In Wikipedia, The Free Encyclopedia, Retrieved July 14,2006, from Http://en.wikipedia.org/wiki/Sand • Weil, John A. (1984) A review of electron spin spectroscopy and its application to the study of paramagnetic defects in crystalline quartz. Phys Chem Minerals 10:149-165 Figure 2 (500X) • EPR signals for Fe+3 centers in amethyst are clearly identified.