Download
1 / 9
100 likes | 256 Views
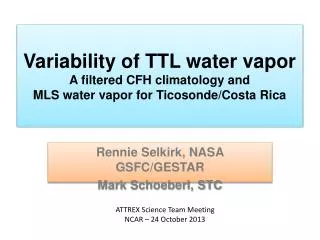
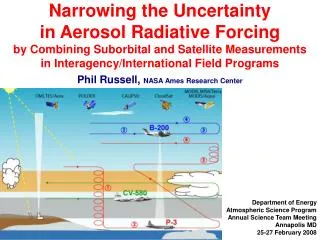
Forecasting tropopause temperatures over Costa Rica for TC 4. Rennie Selkirk, NASA-Ames/BAER Institute Holger V ömel, University of Colorado Leonhard Pfister, NASA-Ames Jessica Valverde, Universidad Nacional Werner Stolz, Insituto Meteorológico Nacional

E N D
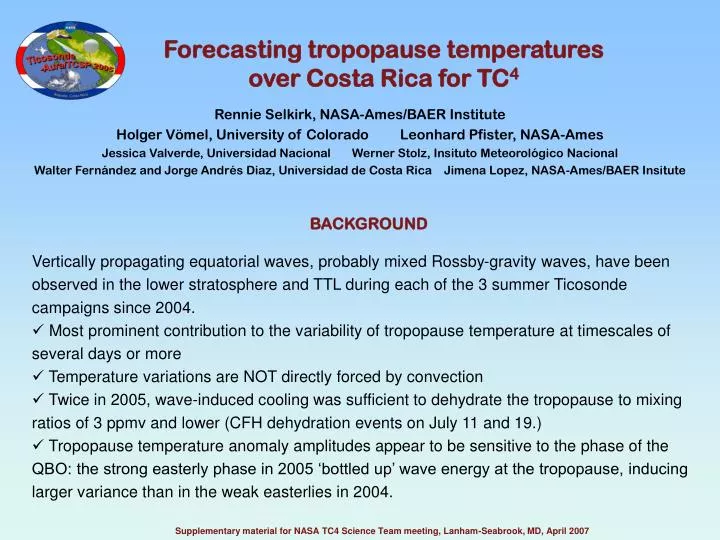
Forecasting tropopause temperatures over Costa Rica for TC4 Rennie Selkirk, NASA-Ames/BAER Institute Holger Vömel, University of Colorado Leonhard Pfister, NASA-Ames Jessica Valverde, Universidad Nacional Werner Stolz, Insituto Meteorológico Nacional Walter Fernández and Jorge Andrés Diaz, Universidad de Costa Rica Jimena Lopez, NASA-Ames/BAER Insitute BACKGROUND • Vertically propagating equatorial waves, probably mixed Rossby-gravity waves, have been observed in the lower stratosphere and TTL during each of the 3 summer Ticosonde campaigns since 2004. • Most prominent contribution to the variability of tropopause temperature at timescales of several days or more • Temperature variations are NOT directly forced by convection • Twice in 2005, wave-induced cooling was sufficient to dehydrate the tropopause to mixing ratios of 3 ppmv and lower (CFH dehydration events on July 11 and 19.) • Tropopause temperature anomaly amplitudes appear to be sensitive to the phase of the QBO: the strong easterly phase in 2005 ‘bottled up’ wave energy at the tropopause, inducing larger variance than in the weak easterlies in 2004. Supplementary material for NASA TC4 Science Team meeting, Lanham-Seabrook, MD, April 2007
Significance for TC4 • Tropopause temperatures during TC4 will exhibit regular variations on the 3-4 day timescale w/ amplitude of ~5 °C • Widespread cirrus more likely during wave-induced cold events • If strong easterly phase of QBO (like 2005), expect increased amplitude of tropopause temperature anomalies and possible dehydration events Forecasting Ttrop during TC4 Ticosonde will provide continual updates of time-height diagrams of temperature and wind using both the sondes and analysis/forecast datasets Supplementary material for NASA TC4 Science Team meeting, Lanham-Seabrook, MD, April 2007
Time-height cross-sections from Ticosonde-Aura/TCSP 2005 • Vaisala RS92-SGP radiosondes • 4X daily: 16 July – 24 August • typically ascents to ~28 km • 2-sec resolution @ 10 m • CU CFH and ECC ozonesondes • 24 launches: 8 – 25 July • most @ 18 UT; 5 @ 00 UT (night) • typical balloon burst at ~30 km Supplementary material for NASA TC4 Science Team meeting, Lanham-Seabrook, MD, April 2007
Ticosonde-TCSP 2005 time-height X-section:Temperature anomalies Cold point range July 11 Dehydration observed by CFH July 19 Dehydration observed by CFH T CFH observations Supplementary material for NASA TC4 Science Team meeting, Lanham-Seabrook, MD, April 2007
Ticosonde-TCSP 2005 time-height X-section:Temperature anomalies Cold point range July 11 Dehydration observed by CFH July 19 Dehydration observed by CFH T Arrows = cold T anoms CFH observations Supplementary material for NASA TC4 Science Team meeting, Lanham-Seabrook, MD, April 2007
Ticosonde-TCSP 2005 time-height X-section:zonal wind anomalies Cold point range July 11 Dehydration observed by CFH July 19 Dehydration observed by CFH U CFH observations Supplementary material for NASA TC4 Science Team meeting, Lanham-Seabrook, MD, April 2007
Ticosonde-TCSP 2005 time-height X-section: zonal wind anomalies Cold point range July 11 Dehydration observed by CFH July 19 Dehydration observed by CFH U arrows = cold T anoms CFH observations Supplementary material for NASA TC4 Science Team meeting, Lanham-Seabrook, MD, April 2007
Ticosonde-TCSP 2005 time-height X-section:meridional wind anomalies Cold point range July 11 Dehydration observed by CFH July 19 Dehydration observed by CFH V CFH observations Supplementary material for NASA TC4 Science Team meeting, Lanham-Seabrook, MD, April 2007
Ticosonde-TCSP 2005 time-height X-section:meridional wind anoms Cold point range July 11 Dehydration observed by CFH July 19 Dehydration observed by CFH V arrows = cold T anoms CFH observations Supplementary material for NASA TC4 Science Team meeting, Lanham-Seabrook, MD, April 2007