Download
1 / 20
380 likes | 1.19k Views
PROJECT NETWORK DIAGRAM. PREPARED BY : NOR AZAH BINTI AZIZ KOLEJ MATRIKULASI TEKNIKAL KEDAH. OBJECTIVES. Define Network Diagram Purpose of Network Diagram Method : Activity On the Node (AON) Identify ES, EF, LS, LF using Forward Pass Calculation and Backward Pass calculation

E N D
PROJECT NETWORK DIAGRAM PREPARED BY : NOR AZAH BINTI AZIZ KOLEJ MATRIKULASI TEKNIKAL KEDAH
OBJECTIVES • Define Network Diagram • Purpose of Network Diagram • Method : Activity On the Node (AON) • Identify ES, EF, LS, LF using Forward Pass Calculation and Backward Pass calculation • Identify Critical Path • Identify Slack Time
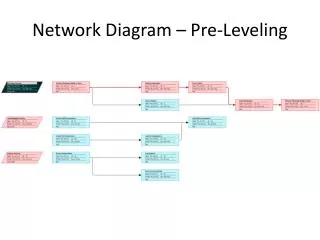
INTRODUCTION • A PND is a pictorial representation of the sequence in which the project work can be done. • The activities and its duration are the basic building blocks needed to construct a graphic picture of the project • Its provide - the earliest time at which work can be begin on every activity that makes up the project - the earliest expected completion date of the project
IMPORTANCE OF ND • ND can be used for ; i) Planning : gives a clear graphical picture of the relationship between project activities ii) Implementation : when updating the project file with activity status and estimate to completion data, the ND is then automatically updated and can be printed or viewed iii) control : while updated ND will retain the status of all activities, the best graphical report and controlling project work will be Gantt Chart
METHODS • THE ACTIVITY ON THE NODE ( AON) • Basic unit of analysis in ND is the activity • Each activity is represented by a rectangle ( activity node) • Arrows represent the predecessor/successor relationship between activities • Every activity in the project will have its own activity node ( each rectangle)
METHODS • THE ACTIVITY ON THE NODE ( AON) B D A F C E PDM format of a project network diagram
METHODS • THE ACTIVITY ON THE NODE ( AON) Dependencies • A dependency is simply a relationship that exists between pairs of activities • 4 types of activity dependencies A B FS : A finishes, B start
METHODS • THE ACTIVITY ON THE NODE ( AON) Dependencies FF : A finishes, B finish A A A B SS : A start, B start
METHODS • THE ACTIVITY ON THE NODE ( AON) Dependencies A B SF : A starts, B finish
Creating an initial project network schedule • THE ACTIVITY ON THE NODE ( AON) B 3 D 5 Start A 1 End F 3 E 2 C 2 Forward Pass calculations
EST, LST, EFT, LFT • CPM uses the following times for an activity EST - Early Start time is the earliest time the activity can begin LST - Late Start Time is the latest time the activity can begin - still allow the project to be completed on time EFT - Early Finish Time is the latest time the activity can end LFT - Late Finish Time is the latest time the activity can end - still allow the project to be completed on time
CRITICAL PATH METHOD (CPM) • An effective way to analyze complex projects • Represent the critical set of activities to complete a project • Help to focus on essential activities which are critical to run the project • Allows the project manager to concentrate on important activities • CP is the longest path on ND and the most important part • Any delays on the CP will lead to delay of the project
FLOAT • Also known as slack, total float and path float • Is computed for each task by subtracting EFT from the LFT ( @ the early start from the late start) • Is the amount of time the task can slip without delaying the project finish date. • Free float is the amount of time a task can slip without delaying the early start of any task that immediately follows it.
EXAMPLE 1. TABLE 1 shows the activities and the durations required to complete a construction project, including the precursor activity. Refering to the TABLE 1: i) draw the project network diagram. ii) state the activities on the critical path. iii) calculate the minimum duration of the project.
13 4 17 D 13 0 17 0 0 7 6 13 1919 17 2 19 0 7 7 ES D EF activity A END F START 14 3 16 0 0 7 0 0 7 0 13 17 0 19 19 19 E 7 5 12 14 1 17 C B 9 2 14 LS F LF project network diagram