Download
1 / 15
310 likes | 1.13k Views
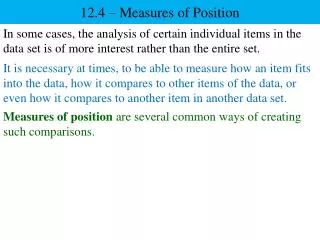
2.5 Measures of Position. First , second, and third quartiles of a data set Interquartile range of a data set Box-and-whisker plots Interpret other fractiles such as percentiles Standard score (z-score). Quartiles.

E N D
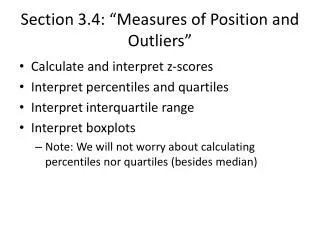
2.5 Measures of Position First, second, and third quartiles of a data set Interquartile range of a data set Box-and-whisker plots Interpret other fractiles such as percentiles Standard score (z-score)
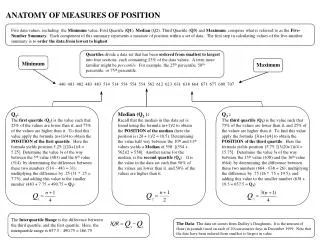
Quartiles The three quartiles, Q₁, Q₂, and Q₃, approximately divide an ordered data set into four equal parts. About one quarter of the data fall on or below the first quartileQ₁. About one half of the data fall on or below the second quartileQ₂ (the second quartile is the same as the median of the data set). About three quarters of the data fall on or below the third quartileQ₃.
Try it yourself 1 • Finding Quartiles of a Data Set Find the first, second, and third quartiles for the ages of the 5o richest people using the data set listed in the Chapter Opener on page 37. What can you conclude? 89 89 87 86 86 85 83 83 82 81 80 78 78 77 76 73 73 73 72 69 69 68 67 66 66 65 65 64 63 61 61 60 59 58 57 56 54 54 53 53 51 51 49 47 46 44 43 42 36 35
Try it yourself 1 89 89 87 86 86 85 83 83 82 81 80 78 78 77 76 73 73 73 72 69 69 68 67 66 66 65.5 65 65 64 63 61 61 60 59 58 57 56 54 54 53 53 51 51 49 47 46 44 43 42 36 35
Try it yourself 2 • Using Technology to Find Quartiles The tuition costs (in thousands of dollars) for 25 universities are listed. Use a calculator or a computer to find the first, second, and third quartiles. What can you conclude? 20 26 28 25 31 14 23 15 12 26 29 24 31 19 31 17 15 17 20 31 32 16 21 22 28 Q₁ = 17, Q₂ = 23, Q₃ = 28.5
Interquartile Range (IQR) The interquartile range (IQR) of a data set is a measure of variation that gives the range of the middle 50% of the data. It is the difference between the third and first quartiles. Interquartile range (IQR) = Q₃ - Q₁
Try it yourself 3 • Finding the Interquartile Range Find the interquartile range for the ages of the 50 richest people listed in the Chapter Opener on page 37. From previous examples we see that Q₁ = 54 and Q₃ = 78. So, the interquartile range is IQR = Q₃ - Q₁ = 78 – 54 = 22
Try it yourself 4 • Drawing and Box-and-Whisker Plot Draw a box-and-whisker plot that represents the ages of the 50 richest people listed in the Chapter Opener on page 37. What can you conclude? The five-number summary of the data set is displayed below. Using these five numbers, you can construct a box-and-whisker plot. Min = 35, Q₁ = 54, Q₂ = 65.5, Q₃ = 78, Max = 89 Interpretation: It appears that half of the ages are between 54 and 78.
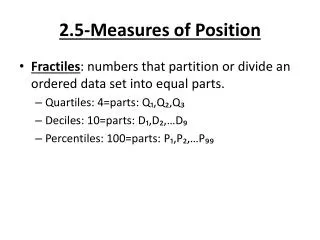
Percentiles and Other Fractiles In addition to using quartiles to specify a measure of position, you can also use percentiles and deciles. These common fractiles are summarized as follows.
Try it yourself 5 • Interpreting Percentiles The ages of the 50 richest people are represented in the cumulative frequency graph below. At what percentile is someone who is 66 years old? How should you interpret this?
Try it yourself 5 From the cumulative frequency graph we can see that someone who is 66 years old is at the 50th percentile. Therefore, 50% of the 50 richest people are younger than 66.
Standard score (z-score) The standard score, or z-score, represents the number of standard deviations a given value x falls from the mean μ. To find the z-score for a given value, use the following formula. z =
Try it yourself 6 • Finding z-scores The monthly utility bills in a city have a mean of $70 and a standard deviation of $8. Find the z-scores that correspond to utility bills of $60, $71, and $92. What can you conclude? x = 60 x = 71 x = 92 z = -1.25 z = 0.125 z = 2.75 Interpretation: From the z-scores, $60 is 1.25 standard deviations below the mean, $71 is 0.125 standard deviations above the mean, and $92 is 2.75 standard deviations about the mean.
Try it yourself 7 • Comparing z-scores from Different Data Sets In 2009, Sean Penn won the Oscar for Best Actor at age 48 for his role in the movie Milk. Kate Winslet won the Oscar for Best Actress at age 33 for her role in The Reader. The mean age of all Best Actor winners is 43.7, with a standard deviation of 8.7. The mean age of all Best Actress winners is 35.9, with a standard deviation of 11.4. Find the z-scores that correspond to the ages of Penn and Winslet. Then compare your results.
Try it yourself 7 Penn = 0.49 Winselt = -0.25 Interpretation: The age of Penn is 0.49 standard deviation about the mean and the age of Winslet is 0.25 standard deviation below the mean. Both z-scores fall between -2 and 2, so neither would be considered unusual.