Download
1 / 37
370 likes | 491 Views
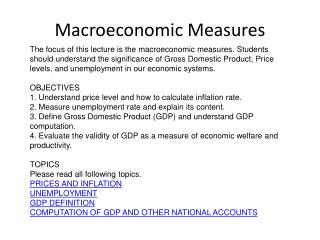
Macroeconomic indicator 1. Inflation is the percentage change in the Price Level ( PL ) from one year to the next. The Consumer Price Index (CPI) is a common measure of the PL

E N D
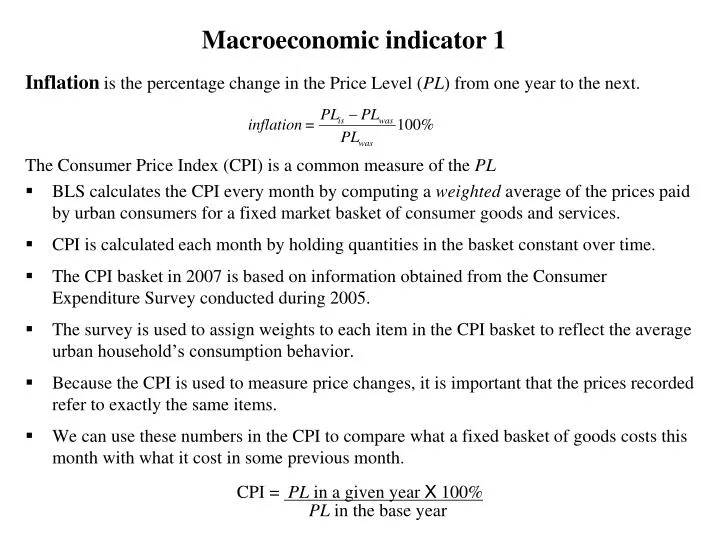
Macroeconomic indicator 1 Inflation is the percentage change in the Price Level (PL) from one year to the next. The Consumer Price Index (CPI) is a common measure of the PL • BLS calculates the CPI every month by computing a weighted average of the prices paid by urban consumers for a fixed market basket of consumer goods and services. • CPI is calculated each month by holding quantities in the basket constant over time. • The CPI basket in 2007 is based on information obtained from the Consumer Expenditure Survey conducted during 2005. • The survey is used to assign weights to each item in the CPI basket to reflect the average urban household’s consumption behavior. • Because the CPI is used to measure price changes, it is important that the prices recorded refer to exactly the same items. • We can use these numbers in the CPI to compare what a fixed basket of goods costs this month with what it cost in some previous month. CPI = PL in a given year X 100% PL in the base year
Inflation Consumer Price Index • The CPI uses a weighted average of the cost (in dollars) of goods and services • The figure below shows the weights used in the CPI market basket • The CPI market basket is a collection of 80,000 consumer goods and services that an average household buys in 30 metro areas. • The CPI for a given year equals the PL in that year divided by the PL in the base year.
Inflation • Suppose I am the “typical” urban consumer and that the government interviews me to determine what goods should be in the CPI market basket. Cost of the CPI basket in 11/06 = $571.5 PL11/06 =
PLcurrent year CPIcurrent year = 100% PLbase year 100 X 100 X 100 X 100 X 100 X 100 X 100 X 100 X 100 X 100 X 100 X 100 X 100 X 100 X 100 X /283.62 = /283.62 = /283.62 = /283.62 = /283.62 = /283.62 = /283.62 = /283.62 = /283.62 = /283.62 = /283.62 = /283.62 = /283.62 = /283.62 = /283.62 = Inflation Base year = 1983 Numbers in the CPI are percentages
CPIis – CPIwas Inflation = 100% CPIwas Inflation The inflation rate • Inflation is a positive percent increase in the price level. • Disinflation occurs when inflation decreases overtime. • Deflation is a negative percent change in the price level.
Inflation Consumer Price Index In part (a), the price level has increased every year. The steeper the CPI curve the higher the inflation rate. The flatter the CPI curve the lower the inflation rate. From the late 1970s there has been disinflation.
Inflation Although the CPI is used as a Cost Of Living Adjustment (COLA) it’s not a COLA because • It does not measure all the components of the cost of living • Some components are not measured exactly • So the CPI is possibly a biased measure. New Goods Bias • New goods do a better job than the old goods that they replace, but cost more. • The arrival of new goods puts an upward bias into the CPI. Quality Change Bias • Better cars and televisions cost more than the versions they replace. • A price rise due to improved quality is not inflation but get measured as inflation. Commodity Substitution Bias • If beef’s price of rises faster than chicken’s, people buy more chicken and less beef. • The CPI basket doesn’t change to allow for the effects of substitution. Outlet Substitution Bias • If prices rise more rapidly, people use discount stores more frequently. • The CPI basket doesn’t change to allow for the effects of outlet substitution. The Boskin Commission estimated the bias to be 1.1 percentage points per year. To reduce the bias in the CPI the BLS now updates the CPI basket every 2 years.
Inflation Distortion of private contracts is a consequence of the bias in the CPI are • Many wage contracts are linked to the CPI. • If the CPI is biased, these contracts might deliver an outcome different from that intended by the parties. Example: Suppose that the UAW and GM sign a 3 year wage deal: In the first year, the wage will be $30 which rises by the inflation rate in the next two years. Assume this contract will affect 30,000 GM employees, each working 40 hours per week, 50 weeks per year. Assume actual inflation is 2% per year but bias in the calculation pushes it up to 5%. The contract results in the following wages using biased inflationusing actual inflation w1 = 30 w1 = 30 w2 = 30(1.05) = 31.50 w2 = 30(1.02) = 30.60 w3 = 31.50(1.05) = 33.08 w3 = 30.60(1.02) = 31.21 Total hours worked at GM per year = (30,000)(40)(50) = 60,000,000 hours Total labor expenses using biased inflation (30)(60m) + (31.50)(60m) + (33.08)(60m) = $5,674,800,000 Total labor expenses using unbiased inflation (that only my mom and God know) (30)(60m) + (30.60)(60m) + (31.21)(60m) = $5,508,600,000 $166,200,000
Inflation Bias in the CPI increases in government outlays • Close to a third of federal government outlays are linked directly to the CPI. • The CPI is used to adjust • 48 million Social Security benefit payments • 22 million food stamp payments • 4 million pensions for retired military personnel, federal civil servants, and their surviving spouses • the budget for 27 million school lunches. Bias in the CPI decreases tax revenue • The CPI is used to adjust the income levels at which higher tax rates apply. • Because tax rates on large incomes are higher than those on small incomes as incomes rise, the burden of taxes would rise relentlessly if these adjustments were not made. • The upward bias means tax adjustments over-compensate for rising prices, moving people from higher tax brackets to lower ones, resulting in a decrease in the amount paid in taxes.
216.18 14 = 5 cents x CPI2009 CPI1936 = Price1936X Inflation Nominal price and real price • To compare dollar amounts at different dates, we need to know the CPI at those dates. • The price of a Hershey bar in 1936 cost 5 cents (1.5 oz) but now costs $1.10 (1.55oz) (see: http://www.foodtimeline.org/foodfaq5.html) Nominal Price Nominal Price Priceof a 1936 Hersey in 1936$ = 5 cents Priceof a 1936 Hersey in 2009$ The real price of a candy bar purchased then valued in 2009 $ = 77 cents
100 201.6 = 16.73 X CPI1983 CPI2006 = wage2006X Inflation Nominal wage and real wage • Suppose you made $16.73 per hour in 2006. • This is the nominal wage valued in 2006 dollars • If you want to compare wages from year to year you have to convert them into real values Nominal wage Nominal wage 2006 wage rate in 2006$ = 16.73 2006 wage rate in 1983$ The real wage rate earned in 2006 valued in 1983 $ = $8.30
Inflation Other price indices • The GDP deflator is an average of prices of all the goods and services included in Gross Domestic Product (GDP is the dollar value of our economy’s total ouput) GDP deflator = 100% • Since the GDP deflator is a measure of the price level its percentage change is a measure of the inflation rate. • The GDP deflator • uses information on current year quantities • it includes new goods • it includes quality improvements • allows for substitution effects of commodities • allows for substitution effects of retail outlets The GDP deflator is less affected by the biases of the CPI. • However, CPI bias is injected into the deflator because when the Commerce Department estimates quantities it divides expenditures by price indexes, one of which is the CPI. • The PCE deflator is similar to the GDP deflator but is an average of current prices of all the goods and services included in the consumption expenditure component of GDP. Nominal GDP Real GDP
Inflation Comparing Price Indices The three measures of the inflation rate fluctuate together, but the CPI measure rises more rapidly than the GDP deflator measure or the PCE deflator measure.
Inflation Comparing Price Indices In part (b), the CPI measure of the price level is the highest and the PCE deflator lies between the CPI and the GDP deflator. The CPI measure overstates the inflation rate. The three measures of the inflation rate fluctuate together, but the CPI measure rises more rapidly than the GDP deflator measure or the PCE deflator measure.
Inflation Costs of expected inflation • Menu costs – change posted prices • Shoe leather costs – make more trips to the bank and search costs • Psychic dislike – people don’t like paying more for the same stuff • Inflation taxes – fixed interest rates Inflation decreases the purchasing power of the dollar • The dollar does not go as far as it use to • The nominal value of some thing is in current dollars. • The real value of some thing is measured in the dollars of a given reference base year (e.g., CPI’s base year is 1983, GDP Deflator’s base year is 2005). • Macroeconomics makes a big issue of the distinction between nominal values and real values: • Nominal price and real price • Nominal wage rate and real wage rate • Nominal interest rate and real interest rate • Nominal GDP and real GDP
Inflation The figure shows nominal and real wage rates: 1982–2006. The nominal wage rate has increased every year since 1982. The real wage rate decreased slightly from 1982 through the mid-1990s, after which increased slightly.
Inflation Nominal and Real Interest Rates • Nominal interest rate is the percentage return on a loan expressed in dollars. • Real interest rate is the percentage return on a loan, calculated by purchasing power—the nominal interest rate adjusted for the effects of inflation. • Real rate of return (r) is the nominal interest rate (i) less inflation (p)
Inflation Nominal and Real Interest Rates • Nominal interest rate is the percentage return on a loan expressed in dollars. • Real interest rate is the percentage return on a loan, calculated by purchasing power—the nominal interest rate adjusted for the effects of inflation. • Real rate of return (r) is the nominal interest rate (i) less inflation (p) The figure shows real and nominal interest rates: 1967–2007. During the 1970s, the real interest rate became negative. The nominal interest rate increased during the high-inflation 1980s. Inflation = 6 – 2.5 = 3.5% Inflation = 10 – (-4) = 14%
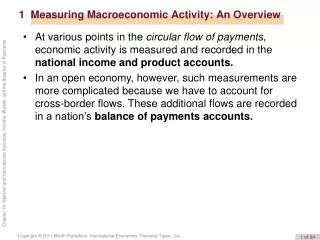
Macroeconomic indicator 2 Economic growth • The economic growth rate = the percent change in real Gross Domestic Product (GDP) • Nominal GDP (nGDP) is the market value of all the final goods and services produced within a country exchanged in formal/legal markets during a given time period • Nominal GDP is the economy’s output valued at the current year’s prices • Real GDP is the economy’s output valued at the base year’s prices • The percent change in nominal GDP≈ growth + inflation • In practice, nominal GDP is computed using the income or expenditure approaches: • nGDP = Wages + Interest + Rents + Profits + Indirect taxes – Subsidies + Depreciation + Statistical discrepancy • nGDP = C + I +G + X – M Net Domestic Productat factor cost
Economic growth Inclusions/exclusions in nGDP • Only the final goods and services count; e.g., • Only the Dell computer you buy is counted, the parts inside the computer do not get counted • An Intel chip sold to your computer geek neighbor George is counted in GDP. • The 2008 Toyota you buy is counted, the tires that came with it are not counted. • Only goods that pass through organized/legal markets are counted. • Illegal gambling and drugs are not counted, neither are garage sales. • The “underground” economy is estimated by many to be more than 10% of GDP. • Leisure is not counted • GDP would be 44% higher if unpaid housework was included (Ann Chadeau, “What is Households’ Non-Market Production Worth?” OECD Economic Studies 18, 1992, pp. 85-103) • Only those goods produced within the boundaries of the USA are counted • Sales of used goods and existing homes are not counted • Purchases of stocks and bonds are not counted (these are loans not goods or services) • Wars and natural disasters over state GDP • Pollution (a bad) is not deducted from GDP
100 = 100 = 100 = 100 = 100 = 100 = 100 = 100 = 100 = 100 = 100 = 100 = Economic growth Nominal GDP and Real GDP
Economic growth The economic growth rate • An expansion occurs when the economic growth rate is positive. • A recession occurs when g is negative for 2 consecutive quarters. • A depression is a long lasting (persistent) recession that last for years.
Economic growth Standard of Living over time • If the economic growth rate exceeds the grow rate of the population the current generation is better than previous generations • In 1967, real GDP in the United States was $3942.5 billion and the population of the United States was 198.712 million. Real GDP per person in 1967 = $19,840 • In 2008, real GDP in the United States was $13,312.2 billion and the population of the United States was 304.06 million. Real GDP per person in 2008 = $43,781 • If the population growth rate exceeds a country’s economic growth rate the current generation is worse off than previous generations.
Economic growth Standard of Living over time • The figure shows the long-term trend in U.S. real GDP per person. • Real GDP per person doubled in the 33 years from 1965 to 1998. • In most years, the real GDP per person increases • Sometimes it doesn’t change.
Economic growth The business cycle • Fluctuations in the pace of expansion of real GDP is called the business cycle. • The business cycle is a periodic irregular up-and down movement in the output of the economy. • The four stages of a business cycle are expansion, peak, recession, and trough. • The shaded periods show the recessions—periods of falling production that lasts for at least six months.
Inflation and Economic growth The PL and GDP are determined by aggregate demand (AD) and aggregate supply (AD) • ASis the relationship between the quantity of GDP supplied and the PL AS • PL and real GDP are determined by the intersection of AS and AD PL • ADis the relationship between quantity of GDP demanded and PL AD AD GDP • If AD increases,inflation and economic growth occur.
Inflation and Economic growth The PL and GDP are determined by aggregate demand (AD) and aggregate supply (AD) AS PL AD AD GDP • If AD decreases, deflation occurs and economic growth is negative.
U . L u = x 100% Macroeconomic indicator 3 Unemployment rate • The Current Population Survey is a joint project of the BLS and the Bureau of the Census • Every month, 1,600 CPS interviewers survey 60,000 households to establish job market status of each member of the household. • Working-age population (WAP) = all people aged 16 years and over not jailed, hospitalized, institutionalized nor in the U.S. Armed Forces. (WAP = L + those not in L) • Labor force (L) is the number of people employed plus the number unemployed (L=E+U ). • The CPS counts as employed (E ) all those in the WAP who, during the prior week, either • Worked at least 1 hour in a paid job or 15 hours unpaid in family business. • Were not working but who had jobs from which they were temporarily absent. • The CPS counts as unemployed (U ) all those in the WAP who, during the prior week, • Weren’t working but were available for work, • Looked for work during the previous 4 weeks ORwere waiting to be recalled to a job from which they had been laid off. • The unemployment rate:
= U . L u = x 100% Unemployment rate U = L – E Types of unemployment • Frictional (uf ): workers temporarily between jobs because of a move/career change. • Structural (us ): workers displaced by automation. • Cyclical (uc ): workers who loose their jobs due to recession. u = uf + us + uc • Natural rate of unemployment (un≈ 5%):It’s the rate at which inflation remains constant. uf + us = 5% uc = 0.81%
Inflation, Economic growth and Unemployment The business cycle • Recessions began in mid-1990 and in first quarter of 2001. • The longest expansion in U.S. history ran from the March 1991 to March 2001. • When GDP decreased in the recession (a), The unemployment rate increased (b). And a little later, the inflation rate decreased (c). • As real GDP increased back toward potential GDP, the unemployment rate fell toward the natural unemployment rate and the inflation rate fell. • The figure shows the recent cycles in real GDP.
Unemployment rate Changes in unemployment • Unemployment depends on the difference between real GDP and potential GDP • Potential GDP is the level of real GDP that the economy would have produced if its labor and capital were fully employed. • Full employment occurs when real GDP = potential GDP • Graphically, it is a vertical line in the AD-AS model • The real wage rate makes the quantity of labor demanded equal to the quantity of labor supplied. • Along the potential GDP line, when the price level changes the money wage rate changes to keep the real wage rate at the full-employment level. • When the economy grows more slowly than its potential, it fails to generate new jobs for its ever growing labor force Y < Yp→ u > un • When the economy grows faster than its potential, the unemployment rate falls. Y > Yp→ u < un • Full employment is reached when uc = 0, which implies u = un 5%
SRAS Inflation, Economic growth and Unemployment Recessionary Gap • A recessionary gap occurs when GDP is less than potential GDP. • Resources, capital, and workers are not being fully utilized, and so u is high. • As a result, there is downward pressure on wages LRAS Note: Unemployment insurance replaces a portion of a newly unemployed worker’s income. Designed to prevent the “next” Great Depression. PL AD Yp GDP
SRAS Inflation, Economic growth and Unemployment Inflationary Gap • An inflationary gap occurs when GDP exceeds potential GDP. • Workers are working overtime and firms are competing for their labor, resulting in low u • As a result, there is upward pressure on wages PL LRAS AD GDP YFE
Inflation, Economic growth and Unemployment • The figure shows the recent cycles in real GDP. The business cycle • Recessions began in mid-1990 and in first quarter of 2001. • The longest expansion in U.S. history ran from the March 1991 to March 2001.
Inflation, Economic growth and Unemployment Source:http://www.bls.gov/
Inflation, Economic growth and Unemployment Source:http://www.bls.gov/
Inflation, Economic growth and Unemployment NAIRU or Natural Rate of unemployment Source:http://www.bls.gov/