Download
1 / 24
320 likes | 522 Views
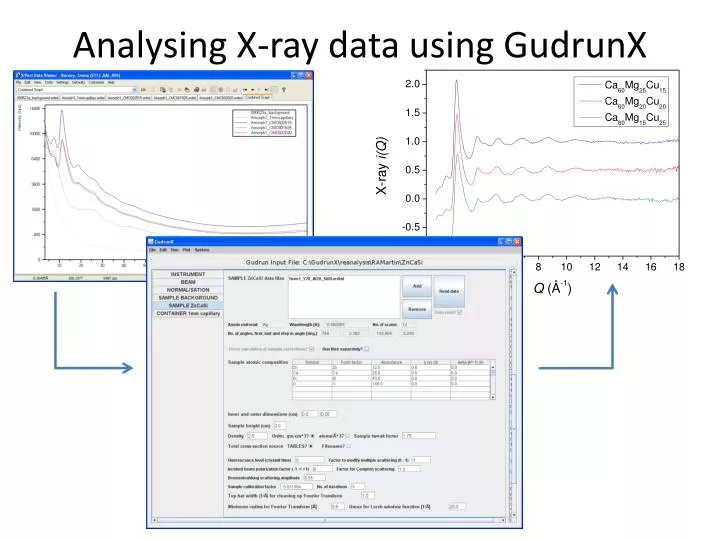
Analysing X-ray data using GudrunX. Outline. Planning an experiment Absorption Fluorescence Beam size Data required Outline of analysis process Step by step guide through analysis Practice with some data! SiO 2 H 2 O Tellurite glass. Planning an experiment.

E N D
Outline • Planning an experiment • Absorption • Fluorescence • Beam size • Data required • Outline of analysis process • Step by step guide through analysis • Practice with some data! • SiO2 • H2O • Tellurite glass
Planning an experiment • Before starting an experiment it is important to have a very good idea of your sample composition and density. • This information will help identify any potential problems which may arise, such as: • Absorption +capillary size • Beam size • Measurements required • Fluorescence (We’ll return to this later) • A good idea of potential problems will help you plan the length of your experiment too. • Strongly absorbing/weakly scattering or strongly fluorescent samples may require longer data collection • Consider what your data will be used for and what quality you require.
Planning an experiment: Absorption If we accept 60% loss offlux, we can estimate the diameter of capillary to use: H2O : µ = 0.656 ln(0.4)/-6.626 = 1.4 cm d ~ 1.8 cm Al2O3 : µ = 6.626 d ~ 2 mm GeO2: µ = 96.906 d ~ 0.12 mm Y2O5: µ = 186.756 d ~ 0.07 mm TeO2 : µ = 68.607 d ~ 0.18 mm PbO : µ = 549.499 d ~ 0.03 mm • Linear (µ) and mass (µ/ρ) absorption coefficients can be calculated from programs such as XOP(1) L 2r Area = πr2 L =(πr2)/2r = π/4 d ~ 3/4 d
Planning an experiment: Absorption Increase Z → increased energy at which K edge occurs. for region around Ag (Z > Ag) µ/ρ < (Z <Ag) HOWEVER, there is also density to consider
Planning an experiment: Absorption • Example: β filter A Material chosen as a β filter must have an absorption edge which lies between the Kα and Kβ peaks. For an Ag tube, Rh is used.
Planning an experiment: Beam size Anti scatter slit Prog. Rec. slit Mask Diameter of sample (L) Prog. Div. slit Soller slit PDS angle (θ) Soller slit Detector Kβ filter X-ray tube 240 mm (r) PDS θ (rad) = L/r ASS= PDS x 2 PRS (mm) = L
Measurements needed Once the experimental setup has been decided up, three measurements are required – as with Neutron analysis, these are: Background Sample in capillary Empty capillary All these measurements need to be taken under the SAME CONDITIONS. The current set up is to collect data at 0.2° intervals from 3.2 – 156°. At each point, data is collected of 30 seconds. There is the option to collect two sets of data: Several repeat scans from 3.2 to 156° Additional scans from 35to 156° to improve statistics at high Q
GudrunX: What does it do? • Calculating the coherent scattering Measured data background data Krogh-Moe – Norman normalisation Compton scattering Polarisation Absorption
GudrunX: What does it do? • Calculating F(Q) Effect of normalisation:
Installing GudrunX The X-ray diffractometer webpages can be found at http://www.isis.stfc.ac.uk/support-laboratories/xrd/xrd9446.html OR as a link from the disordered materials group web page.
Instrument panel: • The required files are all located in the gudrunX folder. • User may wish to alter the Q range of the F(Q) produced, depending on the quality of the data. • The Qmax should be set to the final Qmax you chose for you data.
Beam panel: • Requires minimal alteration. • Edit the beam size if the beam is smaller that the sample. • Ensure the correct bremsstrahlung file is chosen.
Normalisation panel: User must choose which method of normalisation they wish to apply to the data. Altering Breit-Dirac factor and Overlap factor can give some improvements to the extracted F(Q). Maintain default values initially.
Sample background panel: Select an appropriate sample background panel. ‘Read data’ will display the information from the .XRDML file, including number of scans and the range of angles over which the chosen data set has been measured. Set sample background factor (between 0.9 and 1)
Sample specific information required: • Once the instrument and background information has been checked, new tabs need to be added to give sample specific information. • As with GUDRUN this includes a sample and a sample container tab. • Information required includes: • Sample specific information: • Composition • Effective density • Sample size • Fluorescence - a problem for elements in the same row as Ag (Rb – Te) • Multiple scattering • Experimental setup: • Polarisation - 0 • Compton scattering - 1 • Bremsstrahlung - 0.4
Container panel: Composition, container size (inner and outer dimensions), effective density. For density either the measured effective density can be given, with a tweak factor = 0 Or the bulk density can be used with the tweak factor alteredEffective density = bulk density/tweak factor
Sample panel: Basic information + fluorescence, multiple scattering etc. Ensure that packing fraction is sensible (measure or estimate it ~60%) Vary effective density and multiple scattering first, then bremsstrahlung. Only apply fluorescence for samples containing Rb – Te.
GudrunX: Output files .subcan X = 2θ Y1 = experimental data Y2 = single atom scattering Y6 = Bremsstrahlung
GudrunX: Output files .soq X = Q Y1 = F(Q) F(Q) will have been normalised to either <f>2 or <f2>. Ensure that you have a record of which you used!
GudrunX: Output files .gofr X = r Y1 = G(r) Quality of G(r) can be improved by varying parameters in GudrunX. Alternatively, the fourier transform software in Open Genie can be used. Daniel will be discussing the relationship between various correlation functions
Fluorescence X-ray energy > absorption edge in sample → Fluorescence Fluorescence provides a background which is uniformly distributed across the angular range
Fluorescence Multiplying the data measured for the empty capillary and Ca/Sr glass data by a scale factor to match the Ca glass data (at high angle) gives: The shape of the capillary and calcium data are well matched. Problem with strontium sample.
Fluorescence However, if a constant background is subtracting from the Ca/Sr data and THEN the data is scaling: The characteristic X-ray shape is onceagain present in the data