Download
1 / 15
150 likes | 307 Views
Age Group 00-14 years Graft Survival > 1 Year Function 1963-82, 1983-99, 1990-99. Australia. Years. Paed 50. Age Group 15-19 years Graft Survival > 1 Year Function 1963-82, 1983-99, 1990-99. Australia. Years. Paed 51. Age Group 00-14 years Graft Survival > 1 Year Function

E N D
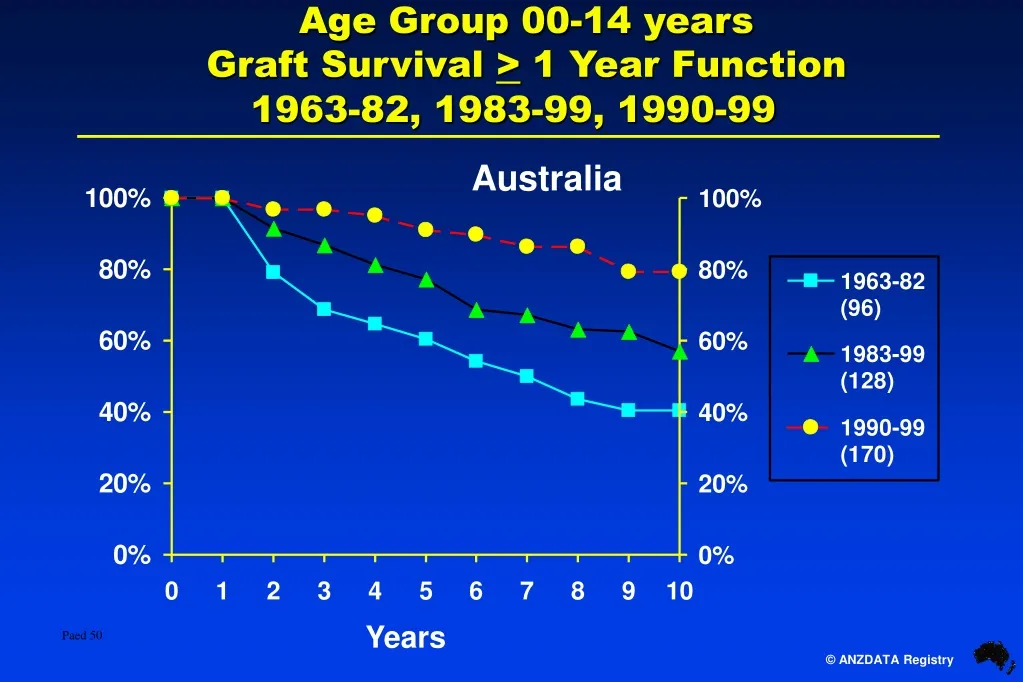
Age Group 00-14 years Graft Survival > 1 Year Function 1963-82, 1983-99, 1990-99 Australia Years Paed 50
Age Group 15-19 years Graft Survival > 1 Year Function 1963-82, 1983-99, 1990-99 Australia Years Paed 51
Age Group 00-14 years Graft Survival > 1 Year Function 1963-82, 1983-99, 1990-99 New Zealand Years Paed 52
Age Group 15-19 years Graft Survival > 1 Year Function 1963-82, 1983-99, 1990-99 New Zealand Years Paed 53
Age Group 00-14 years Primary and Secondary Graft Survival > 1 Year Function 1983-99 Australia Years Paed 55
Age Group 15-19 years Primary and Secondary Graft Survival > 1 Year Function 1983-99 Australia Years Paed 56
Age Group 00-14 years Primary and Secondary Graft Survival > 1 Year Function 1983-99 New Zealand Years Paed 57
Age Group 15-19 years Primary and Secondary Graft Survival > 1 Year Function 1983-99 New Zealand Years Paed 58
Age Group 00-14 years Graft Survival by Cyclosporin dose > 1 Year Function 1990-99 Australia Years Paed 59
Age Group 15-19 years Graft Survival by Cyclosporin dose > 1 Year Function 1990-99 Australia Years Paed 60
Age Group 00-14 years Graft Survival by Cyclosporin dose > 1 Year Function 1990-99 New Zealand Years Paed 61
Age Group 15-19 years Graft Survival by Cyclosporin dose > 1 Year Function 1990-99 New Zealand Years Paed 62
Risk of Any Cancer All Patients - Graft Survival - CD and LRD Age Groups 00-14, 15-19 > 20 years Years Paed 70
Risk of Skin Cancer All Patients - Graft Survival - CD and LRD Age Groups 00-14, 15-19 > 20 years Years Paed 71
Risk of Non Skin Cancer All Patients - Graft Survival - CD and LRD Age Groups 00-14, 15-19 > 20 years Years Paed 72


