Download
1 / 66
760 likes | 971 Views
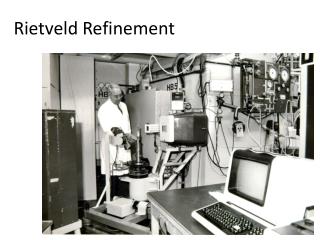
The Rietveld Method. Juan Rodriguez-Carvajal Institut Laue-Langevin Diffraction Group. What is a Rietveld refinement? Structural and profile parameters, standard deviations and R-factors. The calculated profile of powder diffraction patterns. Contains structural information:

E N D
The Rietveld Method Juan Rodriguez-Carvajal Institut Laue-Langevin Diffraction Group What is a Rietveld refinement? Structural and profile parameters, standard deviations and R-factors
The calculated profile of powder diffraction patterns Contains structural information: atom positions, magnetic moments, etc Contains micro-structural information: instr. resolution, defects, crystallite size… Background: noise, incoherent scattering diffuse scattering, ...
The calculated profile of powder diffraction patterns The symbol {h} means that the sum is extended only to those reflections contributing to the channel “i” . This should be taken into account (resolution function of the diffractometer and sample broadening) before doing the actual calculation of the profile intensity. This is the reason why some Rietveld programs are run in two steps
Several phases ( = 1,n) contributing to the diffraction pattern Several phases ( = 1,… n) contributing to several (p=1,… np) diffraction patterns
Integrated intensities are proportional to the square of the structure factor F. The factors are: Scale Factor (S), Lorentz-polarization (Lp), preferred orientation (O), absorption (A), other “corrections” (C)
The Structure Factor contains the structural parameters(isotropic case)
Structural Parameters(simplest case) Atom positions (up to 3n parameters) Occupation factors (up to n-1 parameters) Isotropic displacement (temperature) factors (up to n parameters)
Structural Parameters(complex cases) • As in the simplest case plus additional (or alternative) parameters: • Anisotropic temperature (displacement) factors • Anharmonic temperature factors • Special form-factors (Symmetry adapted spherical harmonics ), TLS for rigid molecules, etc. • Magnetic moments, coefficients of Fourier components of magnetic moments , basis functions, etc.
The Structure Factor in complex cases Complex form factor of object j Anisotropic DPs Anharmonic DPs
Example: General 2dependence of the instrumental broadening (determined by a standard sample) The Gaussian and Lorentzian components of the instrumental Voigt function are interpolated between empirically determined values. If needed, axial divergence is convoluted numerically with the resulting profile.
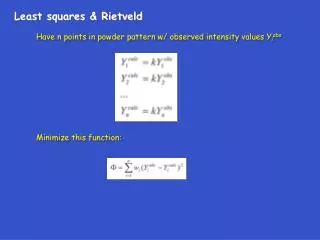
The Rietveld Method : is the variance of the "observation"yi The Rietveld Method consists of refining a crystal (and/or magnetic) structure by minimising the weighted squared difference between the observed and the calculated pattern against the parameter vector:
Minimum necessary condition: A Taylor expansion of around allows the application of an iterative process. The shifts to be applied to the parameters at each cycle for improving c2 are obtained by solving a linear system of equations (normal equations) Least squares: Gauss-Newton (1)
Least squares: Gauss-Newton (2) The shifts of the parameters obtained by solving the normal equations are added to the starting parameters giving rise to a new set The new parameters are considered as the starting ones in the next cycle and the process is repeated until a convergence criterion is satisfied. The variances of the adjusted parameters are calculated by the expression:
Least squares: a local optimisation method • The least squares procedure provides (when it converges) the value of the parameters constituting the local minimum closest to the starting point • A set of good starting values for all parameters is needed • If the initial model is bad for some reasons the LSQ procedure will not converge, it may diverge.
The peak shape function of powder diffraction patterns contains the Profile Parameters(constant wavelength case) The cell parameters are included, through Th, within the profile function. They determine the peak positions in the whole diffraction pattern.
Gaussian function Integral breadth:
Lorentzian function Integral breadth:
I Fwhm BG x x0 Comparison of Gaussian and Lorentzian peak shapes of the same peak height “I” and same width “Fwhm”
Convolution properties of Gaussian and Lorentzian functions
The Voigt function The pseudo-Voigt function
Mapping: Pseudo-Voigt Voigt Thomson-Cox-Hasting formulation
Profile Parameters (simple cases) Parameters controlling the Full-Width at half maximum U, V, W, IG, X, Y
Modeling the Gaussian and Lorentzian components of the profile function in terms of microstructural parameters
R-factors and Rietveld Refinements (1) R-pattern R-weighted pattern Expected R-weighted pattern
R-factors and Rietveld Refinements (2) Reduced Chi-square Goodness of Fit indicator
R-factors and Rietveld Refinements (3) • Two important things: • The sums over “i” may be extended only to the regions where Bragg reflections contribute • The denominators in RP and RWP may or not contain the background contribution
Crystallographic R-factors used in Rietveld Refinements Bragg R-factor Crystallographic RF-factor.
Crystallographic R-factors used in Rietveld Refinements Provides ‘observed’ integrates intensities for calculating Bragg R-factor In some programs the crystallographic RF-factor is calculated using just the square root of ‘Iobs,k’
Simulation of systematic errors in Rietveld refinements Important questions: • What is the effect of the resolution and the systematic errors in the profile peak shape function in the quality of the refined structural parameters? • Are the estimated standard deviations a measure of the accuracy of the refined parameters? • Are the R-factors good indicators of the quality of a structural model?
Complexity of a structural problem:effective number of reflections and solvability index • If one is interested in “structural parameters” the number of independent observations is not the number of points in the pattern N. • What is the number of “independent” observations? (No rigorous answer …) • Points to be considered: • Signal-to-noise ratio, statistics. • Number of independent Bragg reflections: NB • Number of structural free parameters: NI=Nf • Degree of reflection overlap: resolution versus separation between consecutive reflections. • Effective number of observations (resolution weighted): Neff • “Solvability” index: ratio between the effective number of observations and the number of structural parameters: r = Neff/NI
Effective number of reflections Neff Two reflections separated by (Q) can be discriminated properly if the following relation holds: (Q) = 2p2j/(Q2Vo) p DQ DQ is the FWHM in Q-space, p is of the order of the unity A single reflection at Qo contributes to Neff as 1/(1+Nn), where Nn is the number of reflections in the neighbourhood of Qo , verifying: Qo - p DQ Qn Qo + p DQ The formula for calculating Neff is:
Simulation of systematic errors in Rietveld refinements (1) Method: • (1)For a hypothetical (or real) compound characterised by a given crystal structure, scale factor (related to a “ counting time ”), resolution function, peak shape, angular range and background level, calculate a theoretical (deterministic) diffraction pattern: yi(theo) • (2)Nr versions of the “ observed ” diffraction pattern are generated by corrupting the deterministic pattern by a noise calculated with a generator of pseudo-random numbers according to the Poisson distribution : yi(obs) = P{yi(theo)}. • (3)The process is repeated for Nt different values of the “ counting time ” (scale factor), thus producing Nr x Nt observed diffraction patterns for the same compound.
Simulation of systematic errors in Rietveld refinements (2) • (4)Each pattern is refined by the RM by using either the “ true ” model or a biased model (e.g. wrong peak shape). • (5)The values of the refined parameters are then compared to the true valued (bias and dispersion) and the computed standard deviations are compared to the empirical ones obtained from the Nr versions of the same diffraction pattern, as a function of the counting time. • (6)Finally we study the behaviour of the R-factors versus counting time for the different conditions of refinement. • (7)Refine the diffraction patterns without structural model to obtain the “ expected ” R-factors for the best structural model by profile-matching iterating the Rietveld formula for the Bragg R-factor (Le Bail fit)
Results of simulations: Refinements of simulated powder diffraction patterns using correct and biased models
RM (systematic errors): Biased peak shape+ correct structural model NI=39 + bad resolution
RM (systematic errors): Biased peak shape+ correct structural model NI=39 + better resolution
Behaviour of Rietveld R-factors, and other indicators, versus counting statistics for perfect and biased models
RM (systematic errors): Behaviour of R-factors versus counting time (correct model)
RM (systematic errors): Behaviour of RWP factors versus counting time (biased peak shape)
RM (systematic errors): Behaviour of RBragg and RF factors versus counting time (biased peak shape)
RM (systematic errors): Behaviour of DW indicator versus counting time (biased/unbiased peak shape)
RM (systematic errors): Behaviour of reduced Chi-square versus counting time (correct model)
RM (systematic errors): Behaviour of reduced Chi-square versus counting time (biased peak shape)
Behaviour of positional parameters (atom co-ordinates), versus counting statistics, resolution, ... for perfect and biased models
RM (systematic errors): Behaviour of positional parameters versus counting time (biased peak shape)
RM (systematic errors): Positional parameters NI=16 Low counting time (biased peak shape)
RM (systematic errors): Positional parameters, NI=16 Intermediate counting time (biased peak shape)