Download
1 / 16
160 likes | 258 Views
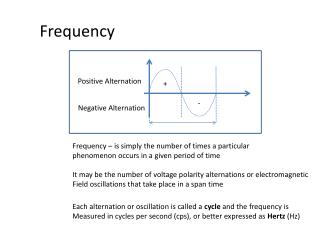
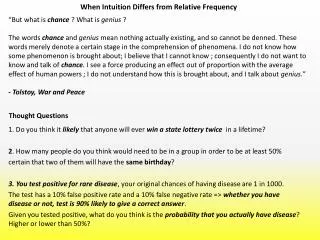
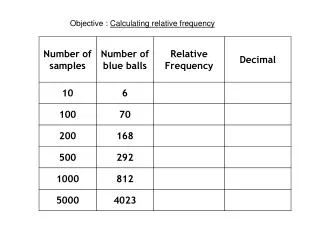
Relative Frequency. And Pie Charts. What is to be learned?. How to use relative frequencies to interpret Pie Charts How to use relative frequencies to draw Pie Charts. Types of Ice Cream. Need to measure angles! . 40 0. 100 0. 80 0. 140 0. Convert to relative frequencies

E N D
Relative Frequency And Pie Charts
What is to be learned? • How to use relative frequencies to interpret Pie Charts • How to use relative frequencies to draw Pie Charts
Types of Ice Cream Need to measure angles!
400 1000 800 1400 Convert to relative frequencies 3600 altogether 100/360 Do not convert nicely to percentages PE 140/360 Art
400 1000 800 1400 If 270 people in survey, how many did PE? PE → 140/360 = 140 ÷ 360 X 270 = 105 of X 270 Multiply by rel freq
Relative Frequency Calculations I am a flower Usually tackled by Rel Freq X Total How many thistles from 900 flowers? Tulip Rose Rel freq = 130/360 1250 1050 1300 No of thistles = 130/360 X 900 Thistle = 325
Drawing Pie Charts Need to calculate the angles Again use relative frequencies
Ronnie the rat Another Exciting Survey 24/144 16.67 35/144 24.31 21/144 14.58 44.44 64/144
Drawing Pie Chart Need to calculate angles 3600 altogether Use relative frequencies (% or fraction) Fractions may be more accurate! Cat: 24/144 360 (or 16.67% of 360) = 24 ÷144 X 360 = 600 of X
Similarly Dog:35/144 X 360 = 87.50 Fish : 21/144 X 360 = 52.50 Rat: 64/144 X 360 = 1600 Should add up to 3600 May not due to rounding (especially if using %)
Relative Frequencies and Pie Charts Rel Freqs help draw and interpret Pie Charts Angle = Rel Freq X 3600
Ex Favourite Day Fri 20 Sat 28 Sun 23 Mon 1 Total 72 Rel freq Fri Sat Sun Mon Angles Fri Sat Sun Mon 20/72 28/72 23/72 1/72 20/72 X 3600 = 1000 28/72 X 3600 = 1400 = 1150 = 50
Pie Chart Zero 1000
Pie Charts 1000 1400 00 1400
Pie Charts Mon Fri Sun Sat