Download
1 / 15
150 likes | 253 Views
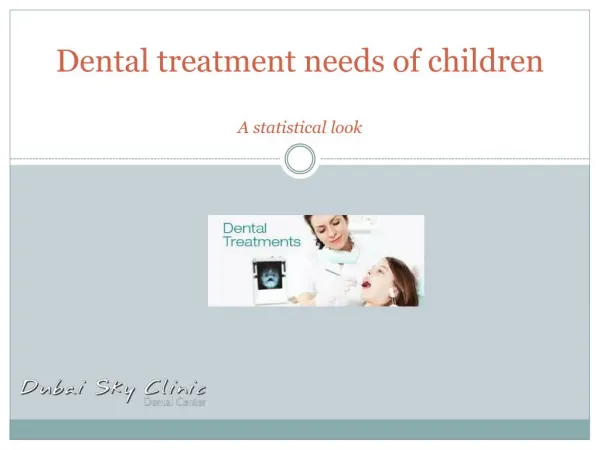
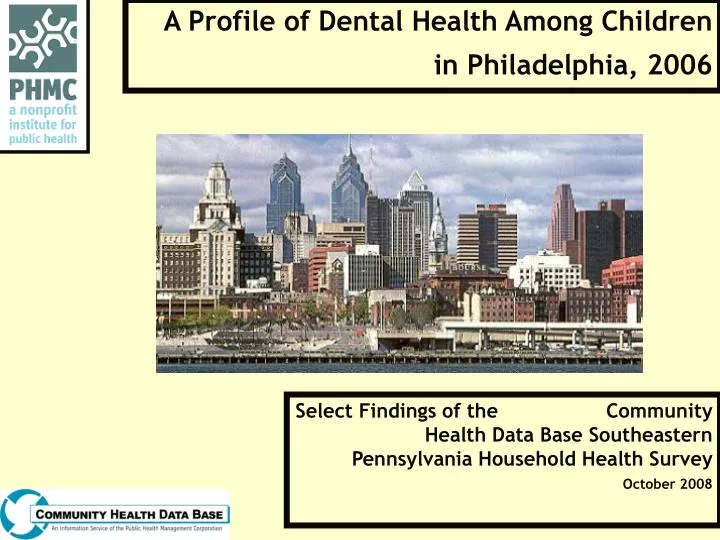
A Profile of Dental Health Among Children in Philadelphia, 2006. Select Findings of the Community Health Data Base Southeastern Pennsylvania Household Health Survey October 2008. Introduction.

E N D
A Profile of Dental Health Among Children in Philadelphia, 2006 Select Findings of the Community Health Data Base Southeastern Pennsylvania Household Health Survey October 2008
Introduction • The data presented here examine dental health among children in Philadelphia (sample size for Philadelphia children = 3,000). This presentation provides information on children ages 4-17. • The data come from PHMC’s Community Health Data Base Southeastern Pennsylvania Household Health Surveys collected during the summer of 2006. The 2008 Household Health Survey is currently in the field and new 2008 data will be available in February 2009.
About the Questions • The questions included in this presentation are: • In the last twelve months, has child been examined or treated by a dentist? • -What is the primary reason that child did not receive dental care? • -During the past 12 months, has there been any time when the child needed dental care but did not get it because of cost?
2006 Household Health Survey Methodology • HHS survey conducted since 1983 • Additional survey years include: 1987, 1991, 1994, 1996, 1998, 2000, 2002, 2004, and 2006. The latest survey – the 2008 SEPA Household Health Survey - is in the field now. • Interviews are conducted throughout the five-county SEPA region: • Bucks • Chester • Delaware • Montgomery • Philadelphia • Interviews conducted by telephone using random-digit dial • Adult & child respondents selected using last birthday method • Oversample: • Persons age 60+ and 75+ • Latino population • Interviews about selected child conducted with child proxy • Interviews conducted in English & Spanish
Figure 1. Children in Philadelphia Who Have Not Been to a Dentist in the Year Prior to the Survey, 2006. Percent • In Philadelphia, almost one in five children (18.2%) were not examined by a dentist in the previous year; this percentage represents 51,100 children in Philadelphia. Data Source: 2006 Southeastern Pennsylvania Household Health Survey. Public Health Management Corporation, Community Health Data Base, 2008.
Figure 2. Children in Philadelphia Who Have Not Been Examined by a Dentist in the Year Prior to the Survey, 1994-2006. • The percentage of children in Philadelphia who had not been examined by a dentist in the year prior to the survey has decreased since 1994 from 27.8% to 18.2% in 1996. • However, the percentage of children not examined by a dentist in 2006 represents a sizeable number of children (51,100). Percent Data Source: 1004, 1996, 1998, 2000, 2002, 2004 and 2006 Southeastern Pennsylvania Household Health Survey. Public Health Management Corporation, Community Health Data Base, 2008.
Figure 3. Percentage of Children in SEPA Who Have Not Been Examined by a Dentist in the Previous Year by County, 2006. Percent • Philadelphia has the highest percentage of children (18.2%) who had not been examined by a dentist in the previous year compared to the surrounding counties: • Bucks 8.8% or 10,300 children • Chester 5.5% or 4,800 children • Delaware 11.4% or 11,900 children • Montgomery 7.3% or 10,400 children • Philadelphia 18.2% or 51,100 children Data Source: 2006 Southeastern Pennsylvania Household Health Survey. Public Health Management Corporation, Community Health Data Base, 2008.
Figure 4. Percentage of Children in Philadelphia Who Have Not Been to a Dentist in the Previous Year by Planning Analysis Section, 2006. Percent • In Philadelphia, Upper North Philadelphia had the highest percentage of children (32%) who had not been examined by a dentist in the previous year. • Roxborough-Manayunk had the lowest percentage (5.4%) of children who had not been examined by a dentist in the previous year. Note: Center City PAS not included due to small sample size. Data Source: 2006 Southeastern Pennsylvania Household Health Survey. Public Health Management Corporation, Community Health Data Base, 2008.
Figure 5. Top Three Reasons Why Children in Philadelphia Have Not Been Examined by a Dentist in the Previous Year, 2006. Percent • Of children in Philadelphia who had not been examined by a dentist in the previous year, one-quarter did not go because they did not think they needed to go and 16.2% did not go due to the cost. Data Source: 2006 Southeastern Pennsylvania Household Health Survey. Public Health Management Corporation, Community Health Data Base, 2008.
Figure 6. Percentage of Children Who Have Not Been Examined by a Dentist In the Previous Year by Age and Race/Ethnicity,2006. Percent • In Philadelphia in 2006, children ages 15-17 (23.5%) were more likely to not have been examined by a dentist in the previous year compared to younger children (15.7% for children ages 11-14 and and 17.1% for children ages 4-10). • Latino children (22.2%) were slightly more likely to not have been examined by a dentist in the previous year compared to black or white children. Race/Ethnicity Age Data Source: 2006 Southeastern Pennsylvania Household Health Survey. Public Health Management Corporation, Community Health Data Base, 2008.
Figure 7. Percentage of Children In Philadelphia Who Have Not Been Examined by a Dentist in the Previous Year by Insurance Status and Poverty Level, 2006. Percent • In Philadelphia in 2006, uninsured children and children living below poverty level were less likely to have been to a dentist in the previous year compared to their counterparts. • Approximately 9,300 children without health insurance and 21,100 low income children were not examined by a dentist in the previous year. Note: Poverty level is defined as below or above 100% of the Federal Poverty Level. Poverty level is calculated based on family size and household income. Data Source: 2006 Southeastern Pennsylvania Household Health Survey. Public Health Management Corporation, Community Health Data Base, 2008.
Figure 8. Percentage of Children In Philadelphia Who Have Not Been Examined by a Dentist in the Previous Year by Insurance Type, 2006. Percent • In Philadelphia in 2006, one in five children with Medicaid coverage and 16.1% of children with CHIP were not examined by a dentist in the previous year. Note: Poverty level is defined as below or above 100% of the Federal Poverty Level. Poverty level is calculated based on family size and household income. Data Source: 2006 Southeastern Pennsylvania Household Health Survey. Public Health Management Corporation, Community Health Data Base, 2008.
Figure 9. Percentage of Children in Philadelphia Who Did Not Receive Needed Dental Care Due to Cost, 2006. • In Philadelphia in 2006, one in ten children did not receive needed dental care due to cost; this percentage represents 27,900 children. • Children ages 11-17 were more likely to not receive dental care due to cost than were younger children ages 4-10. Percent Data Source: 2006 Southeastern Pennsylvania Household Health Survey. Public Health Management Corporation, Community Health Data Base, 2008.
Figure 10. Percentage of Children in Philadelphia Who Did Not Receive Needed Dental Care Due to Cost by Type of Insurance, 2006. • In Philadelphia in 2006, 7.7% of children with Medicaid coverage and one in five children with CHIP did not receive needed dental care due to cost; this represents about 9,000 children. • Four in ten children without health insurance did not receive dental care due to cost. Percent Data Source: 2006 Southeastern Pennsylvania Household Health Survey. Public Health Management Corporation, Community Health Data Base, 2008.
Community Health Data Base: Foundation, Member, & Affiliate Support • Foundations • The Pew Charitable Trusts • The William Penn Foundation • United Way of Southeastern Pennsylvania • Healthcare Resources Foundation • Members (n=44) • Hospitals • Health systems • Managed care organizations • Universities • Government agencies • Affiliates • Over 300 community-based organizations from the five-county region For more information contact: Francine Axler at 215-985-2521