Download
1 / 3
30 likes | 118 Views
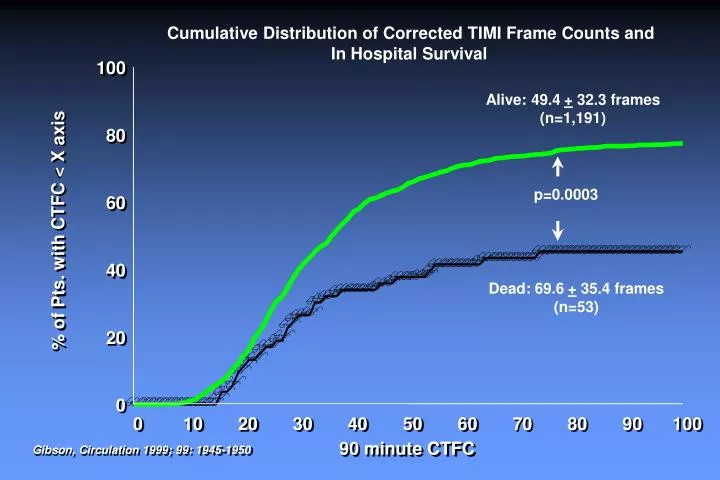
Cumulative Distribution of Corrected TIMI Frame Counts and. In Hospital Survival. 100. Alive: 49.4. +. 32.3 frames. (n=1,191). 80. p=0.0003. 60. % of Pts. with CTFC < X axis. $. $. $. $. $. $. $. $. $. $. $. $. $. $. $. $. $. $. $. $. $. $. $. $. $. $. $. $.

E N D
Cumulative Distribution of Corrected TIMI Frame Counts and In Hospital Survival 100 Alive: 49.4 + 32.3 frames (n=1,191) 80 p=0.0003 60 % of Pts. with CTFC < X axis $ $ $ $ $ $ $ $ $ $ $ $ $ $ $ $ $ $ $ $ $ $ $ $ $ $ $ $ $ $ $ $ $ $ $ $ $ $ $ $ $ $ $ $ $ $ 40 $ $ $ $ $ $ $ $ $ $ $ $ $ $ $ $ $ Dead: 69.6 + 35.4 frames $ $ $ $ (n=53) $ $ $ $ $ $ $ 20 $ $ $ $ $ $ $ $ $ $ $ $ $ $ $ $ $ $ $ $ $ $ $ $ $ $ 0 0 10 20 30 40 50 60 70 80 90 100 90 minute CTFC Gibson, Circulation 1999; 99: 1945-1950
0 Risk of In Hospital Mortality by TIMI Frame Count 5 6.2% p= 0.003 10 % Risk of In Hospital Mortality 2.8% 15 0.0% (n = 18/640) (n =35/563) 21 (n=41) 14 < CTFC < 40 CTFC < 14 CTFC > 40 “TIMI 4” Flow TIMI 3 Flow Reproducibility: r = 0.97 between readers Accuracy: r=0.88 vs Doppler velocity Hyperemic Flow Gibson, Circulation 1999; 99: 1945-1950
TIMI Frame Count & Risk Stratification Within TIMI Flow Grades 50 TIMI Flow Grades p = 0.024 40 50 27.0% 30 Grade 2 Flow 13.0% 20 Grade 3 Flow 10 % Risk of Adverse Outcome 42.9% 50 TIMI Frame Counts p = 0.015 40 22.2% 30 21.7% 18.8% 15.5% 20 7.9% 10 0 < 20 20 < 40 40 < 60 60 < 80 80 < 100 > 100 Gibson et al, Circulation 1999; 99: 1945-1950


![Cumulative distribution [%]](https://cdn1.slideserve.com/2142714/slide1-dt.jpg)