Download
1 / 71
710 likes | 725 Views
UNIT 4 – ECOLOGICAL STUDIES I. INTRODUCTION TO ECOLOGY (pp. 63, 64, 98-104). Founder of Ecology. Ernst Haeckel – “Oikos”. A. Introduction.

E N D
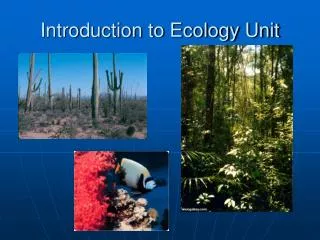
UNIT 4 – ECOLOGICAL STUDIESI. INTRODUCTION TO ECOLOGY (pp. 63, 64, 98-104)
Founder of Ecology • Ernst Haeckel – “Oikos”
A. Introduction • Ecology is the study of interactions between organisms and their environment; therefore the study of ecology includes biotic, or _living_ factors, as well as abiotic (non-living_) factors.
B. Levels of Organization 1. _Species______ - a group of similar organisms that can interbreed and produce fertile offspring
B. Levels of Organization • 2. _Population__ - a group of organisms that belong to the same species and live in one area. The area in which an organism lives is known as its _habitat_. • 3. __Community_ - many different species of organisms living in the same _habitat_ • 4. _Ecosystem_ - a community and the _abiotic_ factors that affect it • 5. _Biome____ - a group of ecosystems that have the same climate and similar _communities_ • 6. _Biosphere_ - Earth
II. “THE STUDY OF . . . “ • Ecologists spend large amounts of time investigating interactions between _biotic_ and _abiotic_factors. It is important that ecologists have an understanding of experimental design. An experimental design that is flawed does not produce valid results or justifiable _conclusions.
A. Laboratory Investigations - There are a variety of ways to conduct a laboratory investigation depending on thedesired outcome. • 1. Comparative – A _comparison_____ of two or more things; for example, comparing plant cells with animal cells under the microscope • 2. Descriptive – Observational lab in which quantitative (_involve numbers, measurements, quantities__) and qualititative (_descriptions__) information is obtained; for example, Seed Journal • 3.Experimental – Designed experiment that follows the _scientific method____. Clearly defined _control___and test group(s).
B. The Scientific Method (pp.3-15) • The term, “scientific method” is misleading because it actually refers to a process that is neither reserved for ecologists and other scientists, nor a methodical set of steps to be followed in a specific order. Instead, it is an _organized__ pattern of thinking to solve everyday problems.
The Scientific Method - “How dull!”, you might say • But it’s actually a tool we use everyday • To shop and compare and problem-solve, too • It’s just a pattern of thinking in much that we do!
III. A CLOSER LOOK AT THE SCIENTIFIC METHOD • A. _Question or Problem__ • B. Forming a _hypothesis__ • A hypothesis is a TESTABLE explanation or prediction
C. Setting Up a Controlled _Experiment_ • To test a hypothesis or find an answer to a question, a scientist will usually set up a controlled experiment. A controlled experiment usually consists of two groups: • 1. Control – Set-up used as a _benchmark or standard for comparison_
Experimental Group • 2. Experimental Group – Group in which all conditions are kept the same except for a _single variable__. A variable is a _factor changed by the experimenter__. Only _one__ factor should be changed in each experimental group. This change is designed to _test the hypothesis. • a. Manipulated (independent) variable – factor that is _changed by the experimenter__ • b. Responding (dependent) variable – condition that is measured or observed as a result of the change
D. Collecting Data • Data from an experiment should be presented in a concise and organized manner. Often _graphs___ are used as a visual representation of the results. The types of graphs used most often to illustrate results are: 1. _Circle (Pie)_ Graph – Used to show relationship of a part to a whole
Graphs • 2. _Bar_ Graph – Used when independent variable isn’t continuous; for example, absorbency of different • brands of paper towels • 3. _Line__ Graph – Used when _independent____ variable is continuous; for example, time. A line • graph most clearly shows the relationship between the independent & dependent variables in an experiment. In a line graph, the manipulated (independent) variable is plotted on the _X__ axis and the responding (dependent) variable is plotted on the _Y__ axis.
Where does distance go? Manipulated (Independent) Variable: _______MIX___________________ Responding (Dependent) Variable: ________DRY__________________
E. Analysis and Conclusion • After collecting data, a scientist must analyze the data and form conclusions based on the following questions: 1. Do the results _support___ or _refute__ the _hypothesis_?
Analysis and Conclusion • 2. Is the experimental set-up _valid___? • a. Was there a large enough _sample size___? • b. Although no experimental set-up can be perfect, were the _sources of error_ minimized? • c. Was there only _one variable___ tested? • 3. Is the experiment _repeatable__?
F. Constructing a Theory • A scientific theory is an explanation that has been _tested__ many times by many different _scientists_. • Although a theory has been confirmed by repeated experiments, it may eventually be disproven.
IV. ENERGY FLOW (pp. 67-73) • All living things require energy. The ultimate source of energy for the earth is the _sun___. • A. Autotrophs – “_Self-feeder____”. They are also known as _producers__. Most producers capture energy from the sun in a process called _photosynthesis_. Photosynthesis takes place in the_chloroplasts_ of plant cells. • The equation for photosynthesis is_CO2 + H2O + light energy → C6H12O6 + O2___.
B. Heterotrophs – Organisms that have to _obtain food_ are called heterotroph or _consumers____. There are several categories of consumers: • 1. Herbivores – Eat _plants (producers)__ • 2. Carnivores – Eat _animals (other consumers)__ • 3. Omnivores – Eat _plants & animals_____ • 4. Detritivores– Obtain energy from _dead bodies of plants and animals; for example, _worms, vultures, _ • 5. Decomposers – Break down _organic__ matter. Most decomposers are in Kingdom _Eubacteria or Kingdom _Fungi_.
C. Energy in a Cell • C. Energy in a Cell – All organisms (_producers_and _consumers_) must convert chemical__ energy present in _glucose_ and other food molecules into usable energy. This conversion process is known as _metabolism__ and the end-product is a re-chargeable “battery” used by all cells for energy known as _ATP___. Most ATP is produced through the process of _cellular respiration_. • The equation for cellular respiration is _ C6H12O6 + O2 → CO2 + H2O +ATP__.
IV. ENERGY FLOW – A COMPARISON OF PHOTOSYNTHESIS & CELLULAR RESPIRATION (p. 232)
C. Tracing Energy Flow • A. Trophic Levels - Each step in the pathway of energy flow is known as a __trophic level_. The first trophic level is always a ___producer____. The 2nd trophic level is known as the primary (1 o) _consumer_ and may be an _herbivore__ or _omnivore_. The last step is always a _decomposer_. • 1. Food Chains – A food chain illustrates how energy is transferred by showing _feeding relationships between organisms. The arrows show the direction of _energy transfer – means “is eaten by”_.
Energy flows through an ecosystem in a series of steps in which organisms transfer energy by being eaten CONSUMERS(Heterotrophs) ________________ _________________ = _________________ ↑ ↑ PRODUCERS(Autotrophs) FOOD CHAIN http://fig.cox.miami.edu/Faculty/Dana/foodchain.jpg
Typical Food Chain Energy (Sun)________ → __Producer____ → _1˚ Consumer (herbivore or omnivore)____ → _2˚ Consumer (carnivore or omnivore)____ → _Decomposer_ EX:Sun-> Grass->Grasshopper->Mouse->Snake->Hawk
·Which organism acts as a secondary consumer? • ·According to this food chain, which organism could be • described as an herbivore? • ·Which organism is the producer? • ·What are two terms that could be used to describe the hawk?
Food Webs • 2. Food Webs – Typically feeding relationships are more complex than illustrated in a food chain. Most organisms eat _a variety of organisms and _are eaten by a variety of organisms. These interconnected pathways are more accurately shown in a food web.
According to this food web . . . • ·How many different producers are there? • ·Is the grasshopper a producer, primary, or secondary consumer? • ·Is the grasshopper an herbivore, carnivore, or omnivore? • ·What organism(s) acts as the decomposer? • ·Give an example of an organism in this food web that acts as secondary and tertiary consumer. • ·If all the squirrels in the community perished, would the hawk be able to survive? Explain. • ·If the grass was destroyed, which organism would be most directly affected? Explain.
Ecological Pyramids • 3. Ecological Pyramids – Although in theory, a food _chain_ or food _web_ can consist of unlimited numbers of _trophic levels_, in actuality this does not take place. On average, only 10%_ of the energy stored in an organism is passed to the next trophic level. _90% of the energy is either used by the organism to maintain _homeostasis_or lost as _heat_to the environment. Because of this, most food chains typically consist of only _3 or 4 trophic levels. Ecologists use _pyramids to represent the amount of _energy_or _matter_at each _trophic level.
V. NUTRIENTS IN AN ECOSYSTEM (pp. 74-80) Unlike energy from the sun, nutrients are only available to an ecosystem in specific quantities and must be recycled_ within and between ecosystems. Nutrients may become a _limiting factor when they are depleted. Organisms require nutrients to _build biomolecules, cells, tissues, etc. Although all nutrients, including _water, are re-cycled, there are a few nutrient cycles that are especially important.
B. Carbon Cycle Organisms require carbon to make _carbohydrates, _lipids_, _proteins_, and nucleic acids. Carbon dioxide in the atmosphere is taken up by _plants____ and _algae___ for _photosynthesis____. (Algae are autotrophic, unicellular organisms with cell walls made of cellulose and chloroplasts that belong to kingdom _Protista_). They produce glucose for _cellular respiration___. Humans and other _consumers___ eat plants & algae, or they eat other organisms who have eaten plants & algae. The carbon from glucose is returned to the atmosphere as _CO 2____, a waste product of cellular respiration. In addition, erosion, burning of _fossil fuels, and _decomposition recycle carbon.
4 main CARBON reservoirs in BIOSPHERE • In ____________ as CO2 gas • In _______ as dissolved CO2 gas • On _______ in organisms, rocks, soil • __________ as coal & petroleum (fossil fuels) and calcium carbonate in rocks atmosphere ocean land Underground CO2 in atmosphere Where does CO2 in atmosphere come from? 1. Volcanic activity 2. Human activity (burning fossil fuels) 3. Cellular respiration 4. Decomposition of dead organisms CO2 in Ocean BIOLOGY; Miller and Levine; Prentice Hall; 2006
Nitrogen Cycle Nitrogen Cycle – Organisms require nitrogen to build _proteins and nucleic acids. The _atmosphere__ is mostly nitrogen, but only _bacteria_ produce the _enzymes_ needed to convert nitrogen from the atmosphere to a useable form, a process known as _nitrogen fixation. After nitrogen fixation is carried out by bacteria in soil, the nitrogen compound in the soil is then absorbed by _plants__ and used to make _proteins & nucleic acids_. When other organisms _eat plants and algae_, they can re-use the nitrogen to build their own proteins_ and _nucleic acids_. When organisms die, _decomposers_ return the nitrogen to the soil where it may be taken up by _plants again or returned to the atmosphere by other _bacteria_.
Nitrogen Cycle • 79% of the atmosphere is made up of NITROGEN gas (N2) BUT we can’t use the nitrogen gas we breathe! The bond in N2 gas is so strong it can only be broken by: lightning Volcanic Activity Specialized bacteria
D. Phosphorus Cycle • D. Phosphorus Cycle - All organisms require phosphorus for DNA, RNA, lipids, and the phospholipid bilayer of the cell membrane. Phosphorus is found in soil and rocks, absorbed by the roots of plants, where it is transported through the rest of the plant by the xylem. Consumers eat plants, which is then returned to the soil
E. Nutrient Limitation • E. Nutrient Limitation – When nutrients are scarce in an ecosystem, they are described as limiting nutrient. • This imposes restrictions on the number of organisms, an organism’s growth, and the • primary productivity of the system. • For example, run-off from fertilized fields can trigger algae blooms in aquatic systems.
VIII. ECOLOGICAL SUCCESSION (pp. 94-97) • Ecosystems are constantly changing in response to natural and human disturbances. As an ecosystem changes, older inhabitants gradually die out and new organisms move in, resulting in further changes in the community. Ecological • succession refers to a series of slow changes that occur in a physical environment over time.
A. Primary Succession • A. Primary Succession – Occurs following destruction of an ecosystem; for example, after Volcaniceruption, glaciers melting: • First species to populate area known as pioneer species