Download
1 / 7
70 likes | 179 Views
Multimodal Learning Environments Critique and Analysis . BrainPOP: Tally Charts and B ar Graphs By: Kaitlyn Derrick. Summary of BrainPOP .

E N D
Multimodal Learning Environments Critique and Analysis BrainPOP: Tally Charts and Bar Graphs By: Kaitlyn Derrick
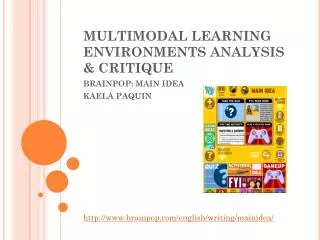
Summary of BrainPOP • The BrainPOP Jr. video on using tally charts and bar graphs helps students better visualize what tally charts and bar graphs are. In this video, Annie and Moby are deciding where the class should go on their next class trip. They are doing this by taking a survey to see where her classmates would like to go next. An easy way to do this is by making a tally chart. Annie gives us an example of how to use a tally chart through the use of a survey on dinosaurs. At the end she tallied up the total for each dinosaur and then converted it into a bar graph. This really helped the students visualize the relationship between the tally charts and the bar graphs. • http://www.brainpopjr.com/math/data/tallychartsandbargraphs/
Common Core Learning Standards • Grades 1 • Represent and interpret data. • CCSS.Math.Content.1.MD.C.4 Organize, represent, and interpret data with up to three categories; ask and answer questions about the total number of data points, how many in each category, and how many more or less are in one category than in another. • http://www.corestandards.org/Math/Content/1/MD
Connections to Moreno and Mayer (2007) Pacing Principle “Students who had control over the pace of the presentation performed better on subsequent tests of problem-solving transfer than those who received a continuous presentation” (Mayer, R. & Moreno, R. 2007. p. 319). • Brain POP allowed students to go forward with the video, or if they missed what was said, the students could rewind the video and re-listen to what was said. “Students learn better when allowed to control the pace of presentation of the instructional materials” (Moreno & Mayer, 2007, p 316). Brain POP also allows students to pause the video to check out what a tally chart and bar graph really looks like. The student was not rushed and could take their time with the manipulative.