Download
1 / 48
500 likes | 1.51k Views
Chapter 20 Cost-Volume-Profit Analysis. Learning Objectives. Determine how changes in volume affect costs Calculate operating income using contribution margin and contribution margin ratio Use cost-volume-profit (CVP) analysis for profit planning. Learning Objectives.

E N D
Learning Objectives • Determine how changes in volume affect costs • Calculate operating income using contribution margin and contribution margin ratio • Use cost-volume-profit (CVP) analysis for profit planning
Learning Objectives • Use CVP analysis to perform sensitivity analysis • Use CVP analysis to calculate margin of safety, operating leverage, and multiproduct breakeven points
Learning Objective 1 Determine how changes in volume affect costs
How Do Costs Behave When There Is a Change in Volume? • Some costs change as the volume of sales increases or decreases. Other costs are not affected by changes in volume. • Different types of costs are: • Variable costs • Fixed costs • Mixed costs
Variable Costs • Variable costs remain constant per unit but change in total as volume changes.
Mixed Costs • Mixed costs have both fixed and variable components.
High-Low Method • A method to separate mixed costs into variable and fixed components is the high-low method.
High-Low Method • Use three steps to separate the variable and fixed costs. • Step 1: Identify the highest and lowest levels of activity and calculate the variable cost per unit.
High-Low Method • Now that we have calculated the variable costs per unit, we can calculate the portion of the mixed costs that relates to the fixed costs. • Step 2: Calculate the total fixed costs.
High-Low Method • Using the variable costs per unit and the fixed costs per unit, we can determine the total mixed costs at various levels of productivity. • Step 3: Create and use an equation to show the behavior of a mixed cost.
Relevant Range and Relativity • The relevant range is the range of volume where total fixed costs and variable costs per unit remain constant.
Learning Objective 2 Calculate operating income using contribution margin and contribution margin ratio
What Is Contribution Margin, And How Is It Used to Compute Operating Income? • A traditional income statement classifies costs by function: • Product costs • Period costs • A contribution margin income statement classifies costs by behavior: • Variable costs • Fixed costs
Contribution Margin • The difference between net sales revenue and variable costs is the contribution margin. • It is called contribution margin because it is the amount that contributes to covering fixed costs.
Unit Contribution Margin • The contribution margin can be expressed as a unit amount. • Note: The terms unit contribution margin and contribution margin per unit are used interchangeably.
Contribution Margin Ratio • A third way to express contribution margin is as a ratio. • Contribution margin ratio is the ratio of contribution margin to net sales revenue.
Learning Objective 3 Use cost-volume-profit (CVP) analysis for profit planning
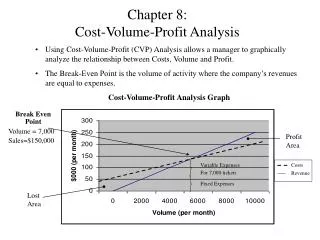
How Is Cost-Volume-Profit (CVP) Analysis Used? • Managers use information about cost behavior to make business decisions. • Cost-volume-profit (CVP) analysis is a planning tool that looks at the relationships among costs and volume and how they affect profits (or losses).
Assumptions • The price per unit does not change as volume changes. • Managers can classify each cost as variable, fixed, or mixed. • The only factor that affects total costs is change in volume, which increases or decreases variable and mixed costs. • Fixed costs do not change. • There are no changes in inventory levels.
Target Profit—Three Approaches • CVP analysis can be used to estimate the amount of sales needed to achieve a target profit. • There are three methods of estimated sales required to make a profit: • Equation approach • Contribution margin approach • Contribution margin ratio approach
The Equation Approach • An equation can be used to estimate the number of units a company needs to sell to achieve target profit or total sales revenue.
The Equation Approach • If Smart Touch Learning desires a target profit of $6,000, using the equation approach, it finds it needs to sell 80 units.
The Contribution Margin Approach • The contribution margin approach is a shortcut method of computing the required sales in units. • The equation approach is rewritten to derive the following equation:
Contribution Margin Ratio Approach • The contribution margin ratio approach computes required sales in terms of sales dollars rather than in units.
Breakeven Point—A Variation of Target Profit • The breakeven point calculation is a variation of the target profit calculation. • The breakeven point is the point at which total revenues equal total costs. • The same three approaches used for target profit can be used to determine the breakeven point.
Learning Objective 4 Use CVP analysis to perform sensitivity analysis
How Is CVP Analysis Used for Sensitivity Analysis? • Managers can use CVP relationships to conduct sensitivity analysis. • Sensitivity analysis is a “what if” technique that estimates profit or loss results if sales price, cost, volume, or underlying assumptions change.
Changes in the Sales Price • If the sales price changes from $500 to $475, the number of units needed to breakeven increases from 54 to 60.
Changes in Variable Costs • If one of Smart Touch Learning’s suppliers raises prices and variable costs increase from $275 to $285, the number of units needed to break even increases from 54 to 56.
Changes in Fixed Costs • If Smart Touch Learning’s fixed costs increase from $12,000 to $15,000, the number of units needed to break even increases from 54 to 67.
Learning Objective 5 Use CVP analysis to calculate margin of safety, operating leverage, and multiproduct breakeven points
What Are Some Other Ways CVP Analysis Can Be Used? • CVP analysis can be used for estimating target profits and breakeven points, as well as sensitivity analysis. • Three additional applications of CVP are: • Margin of safety • Operating leverage • Sales mix
Margin of Safety • Margin of safety is the excess of expected sales over breakeven sales. • Used to evaluate the risk of current operations and their plans for the future.
Operating Leverage • The cost structure of a company is the proportion of fixed costs to variable costs. • Operating leverage predicts the effects that fixed costs will have on changes in operating income when sales volume changes. • The degree of operating leverage can be measured by dividing the contribution margin by the operating income.
Operating Leverage • For Company A, the percentage change in operating income will be 2.5 times the percentage change in sales.
Sales Mix • Most companies sell more than one product. • Sales price and variable costs differ for each product. • Sales mix, or product mix, is the combination of products that make up total sales.