Download
1 / 34
340 likes | 522 Views
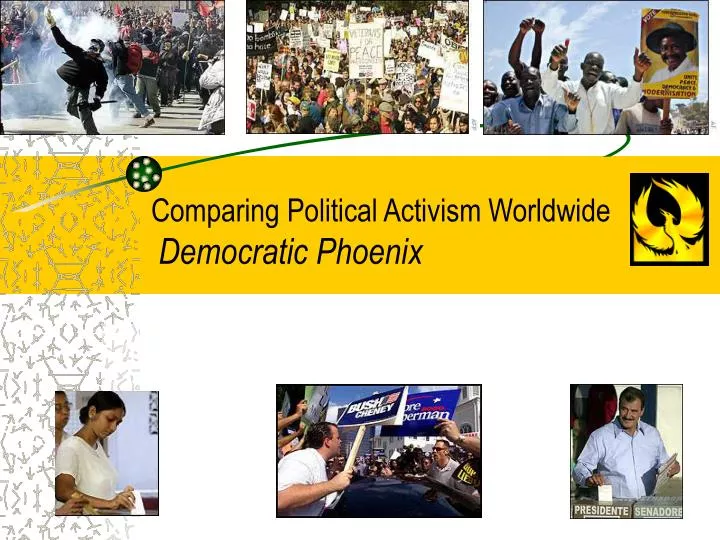
Comparing Political Activism Worldwide Democratic Phoenix. Structure. Theoretical overview: Civic decline or evolution in political activism? Evidence Trends in party membership & civic activism Rise of protest and cause-oriented politics Generational patterns of activism Conclusions

E N D
Structure • Theoretical overview: • Civic decline or evolution in political activism? • Evidence • Trends in party membership & civic activism • Rise of protest and cause-oriented politics • Generational patterns of activism • Conclusions • Causes & consequences of trends?
Democratic Phoenix (Cambridge University Press August 2002) • Introduction: • 1.The Rise and Fall of Political Activism? • 2.Theories of Political Activism • I. The Puzzle of Electoral Turnout • 3.Mapping Turnout • 4.Do Institutions Matter? • 5.Who Votes? • II: Political Parties • 6.Mapping Party Activism • 7.Who Joins? • III: Civic Activism • 8.Social Capital & Civic Society • 9.Traditional Mobilizing Agencies: Trade Unions & Churches • 10. New Social Movements, the Internet & Protest Politics • Conclusions: • 11.Conclusions: From Loyalties to Choice?
The civic decline thesis • Half-empty ballot box? (Wattenberg) • Desertion of party members? (Dalton, Mair) • Partisan dealignment? • Hemorrhaging union rolls? • Emptying church pews? • Anemic voluntary organizations? (Putnam) • Rising political cynicism? (Nye et al)
If participation is changing… • Causes? • Long-term processes of societal modernization? • Growing educational & civic skills • Decline of deferential loyalty to hierarchical institutions • Gradual ‘bottom up’ generational shift in ‘critical citizens’ • Result of changing institutions of representative democracy? • ‘Top down’ explanations • Globalization, decentralization & role of nation state • Growth of cross-cutting issues not accommodated by parties • Rational response to context of choices and channels of influence
If participation is changing… • Consequences? • Social inequality? • Greater civic skills, more demanding acts? • Who participates by class, income, education, gender, ethnicity • Quality of deliberative democracy • F-to-f interaction, on-going co-operation, social trust? • Rise of more demanding citizens? • For governance? • Stability and violence? • Fragmentation of policy process?
Party membership as a % of the electorate, late-1990s % Change (i) Change in Numbers of Members Change in Numbers as Percentage of Original Membership France 1978-1999 1.6 - 3.48 - 1,122,128 - 64.59 Italy 1980-1998 4.0 - 5.61 - 2,091,887 - 51.54 US 1980-1998 1.9 - 2.20 - 853,156 - 50.39 Norway 1980-1997 7.3 - 8.04 - 218,891 - 47.49 Czech Rep 1993-1999 3.9 - 3.10 - 225,200 - 41.32 Finland 1980-1998 9.6 - 6.09 - 206,646 - 34.03 Netherlands 1980-2000 2.5 - 1.78 - 136,459 - 31.67 Austria 1980-1999 17.7 - 10.82 - 446,209 - 30.21 Switzerland 1977-1997 6.4 - 4.28 - 118,800 - 28.85 Sweden 1980-1998 5.5 - 2.87 - 142,533 - 28.05 Denmark 1980-1998 5.2 - 2.16 - 70,385 - 25.52 Ireland 1980-1998 3.1 - 1.86 - 27,856 - 24.47 Belgium 1980-1999 6.5 - 2.42 - 136,382 - 22.10 Germany 1980-1999 2.9 - 1.59 - 174,967 - 8.95 Hungary 1990-1999 2.1 + 0.04 + 8,300 + 5.02 Portugal 1980-2000 3.9 - 0.29 + 50,381 + 17.01 Slovakia 1994-2000 4.1 + 0.82 + 37,777 + 29.63 Greece 1980-1998 6.8 + 3.58 + 375,000 + 166.67 Spain 1980-2000 3.4 + 2.22 + 808,705 + 250.73 ALL ABOVE Trends official party membersTable 6.1 Phoenix
Party membership • Decline in many Western nations • Broader erosion of partisanship • Yet substantial cross-national variations • Does erosion of membership matter? • For party in government? • For party finance and staff? • For party or campaign activism?
US Turnout US Turnout: 59.5% in 2000, 63.8% in 2004 (Vote/VAP) Source: US Census Bureau www.census.gov
Trends in Gross Union DensitySource: Bernhard Ebbinghaus and Jelle Visser. 2000. Trade Unions in Western Europe since 1945. London: Macmillan. CD-Rom.Note: Net density I (Total union membership as a share of the gainfully employed wage and salary earners.)
Union Density: Table 9.1
Interpretation • No simple decline in union membership across Western Europe • Substantial cross-national variations worldwide • Institutional explanations not secular trends
Secularization Trends% Church attendance Eurobarometer 1970-2000
Interpretation? • Evidence of secularization in W.Europe • Development is linked to secularization • Political implications?
% ‘Have done’ All Discuss politics 70.0 Voting turnout 64.5 Civic activism 62.4 Signed a petition * 28.5 Attended demonstrations* 15.7 Joined in boycott * 8.9 Active union member 5.4 Joined unofficial strike * 5.0 Active party member 4.6 Occupied buildings * 1.6 Experience of Political ActivismSource:WVS mid-1990s
Mid-1970s 1980s 1990 mid-1990s Signed petition 32 46 54 60 Demonstrated 9 14 18 17 Consumer Boycott 5 8 11 15 Unofficial Strike 2 3 4 4 Occupied buildings 1 2 2 2 Rise of Protest Politics% ‘Have done’ in 8 postindustrial societies: WVS Source: World Values Surveys
Age differences? • Age differences? • If so three possible causes: • Generational effects, • Period effects, and • Lifecycle effects. • European Social Survey 2002 • 15 European nations (22)
Type of acts • Citizen-oriented repertoires • Voted • Contacted a politician or official • Donated money to political organization • Party member • Worked for a political party • Cause-oriented repertoires • Bought products for political reasons • Signed a petition • Boycotted certain products • Lawfully demonstrated • Took part in illegal protest
Mean age of activists Note: Whether the respondent did these acts during the previous 12-months Source: The European Social Survey, 2002
Conclusions • From the politics of loyalties to the politics of choice? • Citizen oriented action peak in middle age • Cause-oriented acts most common among young people • Associations: Mixed pattern • Young people not more engaged in new social movements
Discussion Questions • Does this reflect your own experience? • If so, what are the causes? • Globalization reducing the power of the nation-state? • Rise of more ‘critical citizens’? • And what are the consequences? • For democracy • For governments & policy process