Download
1 / 29
290 likes | 297 Views
Single plant yields: The NE experience. Why talk about individual plants when farmers are shelling up to 40ft swaths?. Because there is more to the story then what meets the combine!!!!!. Lets talk about yield per area and yield per plant over the past 40 years!.

E N D
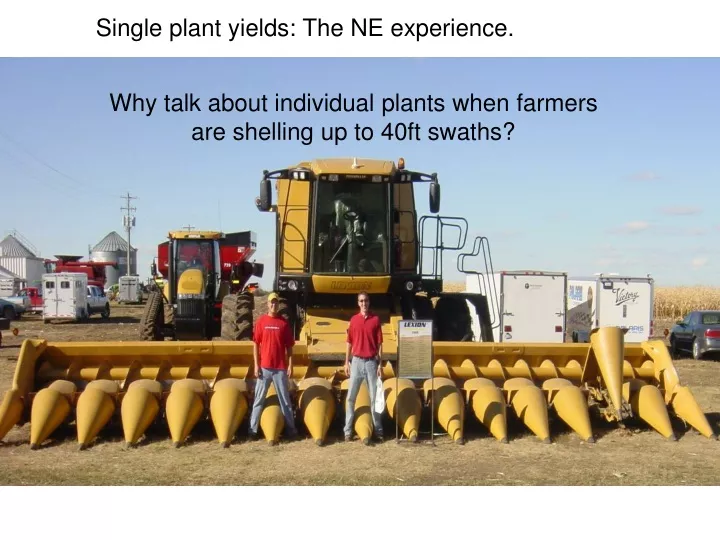
Single plant yields: The NE experience. Why talk about individual plants when farmers are shelling up to 40ft swaths?
Because there is more to the story then what meets the combine!!!!! Lets talk about yield per area and yield per plant over the past 40 years!
Average Yields reported for 5 states: IA, IL, IN, MN, NE 2010 5 state avg. = 160 bu ac-1 2020 5 state avg. = 180 bu ac-1 Data from USDA NASS objective yield data available online http://www.usda.gov/nass
Data from USDA NASS objective yield data available online http://www.usda.gov/nass
2010 28,427 plants ac-1 2020 31,261 plants ac-1 Data from USDA NASS objective yield data available online http://www.usda.gov/nass
Data from USDA NASS objective yield data available online http://www.usda.gov/nass
Well what about those NCGA Contest winners? 2004 winners are as follows: 332 bu ac-1 43,980 plants ac-1 Francis Childs 192 g plant-1 Manchester, IA 320 bu ac-1 38,500 plants ac-1 Mark Dempsey 211 g plant-1 Fowler, IL 296 bu ac-1 47,000 plants ac-1 Jeff Mezera 160 g plant-1 Bagely, WI Data available from http://www.ncga.com
So where is the rest of the story???? Lets look at within a given population at individual plant yield.
Plants with a skip on one side Plants with a neighbor on each side Plants next to a double skip
From the previous graph: 1) Within each cluster, there is enormous amount of variability. 2) In the first cluster of plants with a normally spaced neighbor, there can be 8x difference in yield. 3) Plants do not always adjust yield based on distance to its neighbors. Or they don’t always use the extra space.
Therefore, when converted in individual yield per area, maybe distorting the plants demand for nitrogen. Consider three plants each yielding 150 g of grain, 1st plant has two normally spaced neighbors. 2nd plant is missing a neighbor. 3rd plant is missing both neighbors. The first plant yield is higher per unit area because there is less area occupied. The second plant has a lower yield per unit area because he as more area. The third plant’s yield is drastically lower than the other two because it’s the only show in town.
Individual yield per unit area. However, when averaged out over the entire acre the yield will be the same. Grain Per Plant. More accurate picture of each plant’s potential need for nutrients, but you need to know the number of plants per acre. As Nitrogen management resolutions become smaller there becomes more of a need to know how many plants are in that given area.
20 in rows in southwest Kansas (east of Liberal) Population = 38,500 ac-1 (95,095 ha-1)
If distance to nearest neighbor is not the Master variable, then what is? Maddonni, G.A., and M.E. Otegui. 2004. Intra-specific competition in maize:early establishment of hierarchies among plants affects final kernel set. Field Crops Res: 85:1-13. Basically, Maddonni and Otegui said that hierarchies established at V6 are present at harvest. Could these hierarchies be established earlier than V6 and if so can nitrogen management per plant change these relationships?
By Plant NUE Study, Shelton, NE 2004 Plot size 4 rows (76 cm) 15 ft long, RCBD with 4 reps. 9 N management treatments Entire area was planted with a 4 row unit planter and plants were tagged when it was first visible by the eye with a plastic stake.
If you had the power (A magic wand) and could meter out nitrogen per plant, which plant would you give more nitrogen? Emerged 5 days after planting Emerged 8 days after planting
How about these guys? Which plant should get the N? Looking straight down on same plants Side view with DAP stakes
Plant height measured from the ground to the tip of the tallest leaf when the leaves were folded up at approximately the V5 growth stage. Data taken on 6/26/04 (39 days after planting). A A B B C C D D E E F F G G
Conclusions: • Over the long term we are increasing yields by • increasing plant population, and yield per plant is stable over time. • Individual yield per area may not reflect actual yield • of the plant. But will average out over to the true • mean per acre. • 3) Yield per plant reflects each plant’s potential need for N. But you need to know the number of plants in acre. • 4) Big plants yield more than little plants. Early emerging plants yield more than later emerging plants.
5) Nitrogen can boost yield of later emerging plants up to a certain point. 6) Very seldom does a plant yield over 200 g and even more rarely does it yield over 250 g per plant.
The good news is that to break the standing record (428.5 bu ac-1)posted by Francis Childs (2002) at the same population he had (44,000 plants ac-1) by 1 bu ac-1 you only need to average 248 g plant-1 !