Download
1 / 106
1.07k likes | 1.17k Views
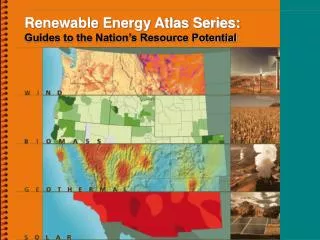
California Renewable Energy resource potential and Cost update. Black & Veatch. Presentation Outline. Introduction California Cost and Resource Assessment Solar Wind Bioenergy Geothermal Out of State Resources Future Cost Declines Zone Identification. 1. Introduction.

E N D
California Renewable Energy resource potential and Cost update Black & Veatch
Presentation Outline Introduction California Cost and Resource Assessment • Solar • Wind • Bioenergy • Geothermal Out of State Resources Future Cost Declines Zone Identification
Project Objective The objective of this project is to prepare a comprehensive and up-to-date data set of cost, performance, and resource potential for renewable energy in California and the West This information will be used in the RPS Calculator and potentially other applications The last comprehensive California resource assessment was the Renewable Energy Transmission Initiative (RETI, 2008-2010) • Many changes in the market necessitate this update
Content generated under this project This PowerPoint summarizing approach Detailed maps showing location and quality of potential Tables and spreadsheets with resource potential and cost (incorporated into RPS calculator)
Cost and Resource AssessmentDiscussion Topics Summary of Cost and Resource Assessment General Approach Resource Exclusions Solar PV Solar Thermal Wind Bioenergy Geothermal
Introduction to Summary This section summarizes: • Major methodological changes in the cost and resource assessment compared to the approach taken in RETI • Key results, especially as they compare to previous RETI work Much more detail included later in this presentation and in reference material
Box and Whisker Plots Maximum 3rd Quartile Average Median 1st Quartile Used to compare ranges in estimates across major resource assessments: • RETI 1B – 2008 • RETI 2B – 2010 • RPS Calculator – 2013 Three key variables summarized • Capital cost • Capacity factor • Resource potential Minimum
Solar PV Methodology Changes • Completely new state-wide resource assessment for fixed and tracking PV from 250 kW to 20 MW+ • Much lower capital costs • Potential for significantly higher performance driven by modern plant designs • Incorporated E3 “Local Distributed PV” study for DG potential Results • Much lower LCOE than previously estimated • Good-to-excellent quality PV resources available throughout state
Solar PV Changes (Tracking, 20+ MW) Capital Cost, $/kWac Capacity Factor, %ac Resource Potential, MWac State-wide Southern CA State-wide Excludes distributed PV
Solar PV Changes (Tracking, 20+ MW) Capital Cost, $/kWac Capacity Factor, %ac Resource Potential, MWac Statewide resource CF up to 36% for best sites Reduced capital cost State-wide Southern CA State-wide Excludes distributed PV
Solar Thermal Methodology Changes • Only minor changes • Increased capital costs to reflect current costs • Added Power Tower with 6-hour storage Results • No changes in resource potential • Slightly higher costs
Solar Thermal Changes (No Storage) Capital Cost, $/kWac Capacity Factor, %ac Resource Potential, MWac RETI 1B included wet and dry-cooled plants. RETI 2B and the current estimates are dry-cooled only.
Solar Thermal Changes (No Storage) Capital Cost, $/kWac Capacity Factor, %ac Resource Potential, MWac No changes No changes Increased capital cost RETI 1B included wet and dry-cooled plants. RETI 2B and the current estimates are dry-cooled only.
Wind Methodology Changes • Characterized low wind speed resources using new turbine designs • Reduced minimum wind speed for development from 6.3 to 5.5 m/sec • Reduced capital costs • Accounted for significant wind development that has occurred in last 5 years • Removed restriction on development in RETI category 2 lands (yellow) • Added distributed resources Results • Overall costs significantly lower • Total potential relatively unchanged, but much more wind identified in Northern California • Quality of identified resources lower on average
Wind Changes Capital Cost, $/kWac Capacity Factor, %ac Resource Potential, MWac Excludes distributed wind
Wind Changes Capital Cost, $/kWac Capacity Factor, %ac Resource Potential, MWac Increase in low wind potential Reduced capital cost 75% of identified wind >30% CF 75% of identified wind <30% CF Excludes distributed wind
BioEnergy Methodology Changes • Accounted for biomass already being used and competing uses • Added distributed resources (incl. biogas) in compliance with SB 1122 • Adjusted costs upward slightly to account for inflation Results • Resource potential and costs relatively unchanged • Average plant size is smaller, which increases average cost • Distributed resources now available
Bioenergy Changes Capital Cost, $/kWac Capacity Factor, %ac Resource Potential, MWac DG Capital cost and capacity factor exclude distributed bioenergy
Bioenergy Changes Capital Cost, $/kWac Capacity Factor, %ac Resource Potential, MWac No changes Slight reduction Increased capital cost DG Capital cost and capacity factor exclude distributed bioenergy
Geothermal Methodology Changes • Only minor changes • Accounted for development that has recently occurred • Adjusted costs upward slightly to account for inflation Results • Resource potential and costs relatively unchanged
Geothermal Changes Capital Cost, $/kWac Capacity Factor, %ac Resource Potential, MWac
Geothermal Changes Capital Cost, $/kWac Capacity Factor, %ac Resource Potential, MWac Slight reduction No changes Increased capital cost
Approach – Sources of Data for Resources Black & Veatch developed new cost and performance information from internal sources, market data, and other literature (LBNL, DOE, CEC) When possible, previously-vetted information from other Black & Veatch stakeholder projects was used • Renewable Energy Transmission Initiative (2008-2010) • Western Renewable Energy Zones (2009, 2012-2013) • SB1122 Biomass Feed-in Tariff (2013) • NREL Renewable Electricity Futures (2010)
Approach – Renewable Energy Transmission Initiative RETI was active from 2008-2010. Two major resource assessments: • RETI 1B – 2008 • RETI 2B – 2010 The RETI methodology was reviewed extensively by stakeholders and reused to the greatest extent possible Updated as necessary to address significant changes market
Approach – General Methodology Capital Cost Updates • Costs are “all-in” installed costs and include EPC + owner’s costs (soft costs) • Costs include costs through the interconnection to the T&D system • Costs are for 2013 projects – Future cost forecast curves developed for all technologies Operation and Maintenance (O&M) Cost Updates • Black & Veatch O&M cost estimates include all other annual costs, including land lease, insurance, and property tax* Resource potential and performance was updated for all technologies compared to the RETI assessment • Major methodology changes made for wind and solar PV • Small-scale bioenergy from SB 1122 analysis • Minor updates to all other resources (Solar Thermal, Geothermal, Biomass) *Solar PV is currently exempt from property tax in CA
Approach – Costs Based on Updated Resource Assessment for California A comprehensive resource assessment was completed identifying specific project locations • This is a more detailed approach for assessing the costs of the remaining CA developable potential than generic ranges • Costs for individual locations can vary widely • Costs presented in this presentation represent the range of values from the resource assessment • Comprehensive resource assessments should show much higher costs at the high end than observed in the market today
Capital Cost, Performance, and Resource Potential Are connected Declining capital cost trends make improved performance more affordable Developers may opt to pay higher capital costs for increased performance (low wind speed turbines, tracking PV, higher PV dc/ac ratios) • Black & Veatch is observing this in the market Lower LCOE (and other market factors) enables much more resource to be economically available than previously estimated by Black & Veatch
Important Note - Estimates are not Points Estimates are not points, they are ranges • What is the cost for a house in the US? Status of technology development, status of design, site specifics, contracting approaches, market conditions and other factors can all impact cost Estimates for a single project at a single site with identical design will be bid at different costs by different EPC (Engineer-Procure-Construct) contractors So when you add different sites and different contracting approaches the ranges of estimates widen further Uncertainty exists in all estimates
Approach – Sources of Internal Black & Veatch Cost Data Black & Veatch Design & Construction Projects Financial due diligence • Project finance, mergers and acquisitions Bid Reviews for Developers, Utilities, and Others Market modeling and assessments • Energy market modeling, forecasts, integrated resource planning, locational marginal pricing Broad, high-level studies • Strategic planning (RETI, Western Renewable Energy Zones, etc.)
General Land Exclusions Not all lands are suitable for renewable resource development Land exclusions were generally based on: • Previously-agreed exclusions in RETI • Updated environmental exclusions • Resource-specific exclusions (e.g., military flyways for wind) – discussed later
General LAND Exclusions Military Lands (some exceptions) Tribal Lands Active Mines Airports Urban and Built-up Land Water Bodies Example For Southern California
Environmental Exclusions Focus has been to remove lands where development is prohibited or practically impossible Merged stakeholder-vetted public datasets: • RETI Category 1 – “Development Prohibited” • WECCEDTF* Category 4 – “Areas Presently Precluded by Laws or Regulation” • Feinstein California Desert Projection Act Consistent with DRECP exclusion areas for conservation lands Have not screened out any other lands for environmental reasons. These may be “scored” (0-100) rather than removing them entirely WECCEDTF = Western Electricity Coordinating Council Environmental Data Task Force http://www.wecc.biz/committees/BOD/TEPPC/Pages/EDTF_Home.aspx
Solar PV Approach Completely revised approach from 2008-2010 RETI to capture major improvements in technology Included three major configurations • Tracking • Fixed-tilt • Rooftop Sizes from 250 kW – 20 MW+ (ac rating) Updated resource, performance, and cost
Summary of Changes to Solar PV Cost updated for systems from 1 to 20+ MW (ac rating) • Fixed Tilt and Single Axis Tracking • Black & Veatch assumes little appreciable economies-of-scale after 20 MW. Therefore a single estimate is provided for systems that size and larger. Smaller-scale rooftop systems also included (250 kWac) Higher performance systems assumed • Increased dc to ac ratio, also known as inverter loading ratio (up to 1.4) • Higher ac capacity factors Capital costs include a $200/kW allowance for interconnection costs (except for rooftop, where interconnection costs are assumed to be minor and included in the system costs) While overall trend is decreasing solar PV costs, higher performance is achieved by increasing inverter loading ratio which increases capital cost
Solar PV Development Exclusions - utility-Scale Rooftop and distributed assessment separate Resource-specific • Williamson Act • Prime • Farmland Security Zone (FSZ) • “Mixed” • Land slope greater than 5 percent General • Environmental • Water • Native American Lands • Military Lands • Mines • Urban Areas • Airports
Solar PV Performance Significantly Higher than Previously Estimated (RETI 1B Max CF = 28%, now 35+%) Tracking Fixed Tilt Capacity Factor (ac)
Distributed pv potential Potential identified by Energy and Environmental Economics, Inc. (E3) • From “Technical Potential for Local Distributed Photovoltaics in California” Study • Study estimates the technical potential for “local” distributed photovoltaics • Study defines local distributed as PV sized such that its output will be consumed by load on the feeder or substation where it is interconnected
Capital Cost assumptions Fixed Tilt Design Single Axis Tracking Design Small-scale system (rooftop application)
PV Cost Comparison with RETI • 20 MW, Single Axis Tracking All O&M costs modeled as fixed for simplicity
Solar thermal No update to potential Original resource potential identified in RETI 2B (2010) used Solar Thermal Project Locations
Solar Thermal cost updates Cost data for developed projects is limited due to low activity in the sector Black & Veatch’s capital cost estimates were increased slightly relative to initial RETI estimates based on reported costs for projects in the DOE loan guarantee program and other data sources RETI costs were based on parabolic trough technology • This update includes an estimate for solar power tower as well
Solar Thermal Cost Comparison with RETI 200 MW solar thermal plant All O&M costs were decided to be modeled as fixed.