Download
1 / 27
270 likes | 429 Views
CAPACITY BUILDING TO EVALUATE AND ADAPT TO CLIMATE CHANGE-INDUCED VULNERABILITY TO MALARIA AND CHOLERA IN THE LAKE VICTORIA REGION. AN OVERVIEW OF PROJECT PRESENTED BY SHEM O. WANDIGA PRINCIPAL INVESTIGATOR KENYA NATIONAL ACADEMY OF SCIENCES P.O. BOX 39450 Tel: 254-02-311714

E N D
CAPACITY BUILDING TO EVALUATE AND ADAPT TO CLIMATE CHANGE-INDUCED VULNERABILITY TO MALARIA AND CHOLERA IN THE LAKE VICTORIA REGION AN OVERVIEW OF PROJECT PRESENTED BY SHEM O. WANDIGA PRINCIPAL INVESTIGATOR KENYA NATIONAL ACADEMY OF SCIENCES P.O. BOX 39450 Tel: 254-02-311714 Fax: 254-02-311715 Email: knas@iconnect.co.ke
Project Team are:P.Z. YandaR. Kangalawe TanzaniaRehem Jackton SigallaP.P. MugambiE. Kirumura UgandaR. KabumbiliS.O. WandigaM. OpondoD.O. Olago KenyaF. MutuaFaith W. GithuiTim Downs U.S.A
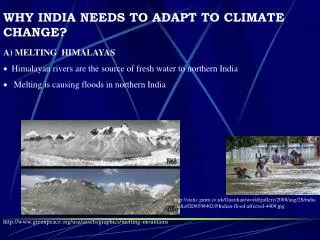
Every 30 seconds a child dies of malaria. In the poorest 20 per cent of the world’s population malaria takes many more lives than HIV/AIDS. Why then do we hardly notice malaria stories and programmes in the media? Asks Angela Dawson of Liverpool School of Tropical Medicine, U.K.
Cholera epidemics have been associated with El Niño rains. The epidemic when it occurs claims many lives and disrupts societal functions. How are malaria and cholera related to climate change? What is the contribution of socio-economic status of the affected communities to severity of the epidemics?
PROJECT OBJECTIVES • To develop climate change scenarios using General Circulation Models (GCM). • To develop a Geographic Information System (GIS) • To analys time series data to link precipitation and temperature change with incidences of malaria and cholera in six vulnerable communities in Kenya, Uganda and Tanzania. • To analys the socio-economic status of communities, disease rates and the sensitivities of these rates to climate variables. • To identify communities at highest risk from exposure to malaria and cholera agents under different climate change scenarios. • To evaluate existing adaptation capacity of vulnerable communities. • To work with identified high-risk communities to generate improved adaptation capacity. • To examine climate and non-climate determinants of malaria and cholera risk in order to inform policy-making that builds adaptation capacity.
Lake VictoriaPosition: 0o 21’ N and 3o’SAge: 4000,000 years oldSurface Area: 68,800 Km2Catchment Area: 184,000 Km2Lake temperature: 0.5oC warmer than in 1960s.
The Riparian Communities has Seen rapid population expansionYearPopulation1820 23 million1932 4.6 million1995 27.7 million2030 53 million (projected)
Economic StatisticsGross economic product US$ 3 to 4 million annuallyAverage income range US$ 90 to 270 per annum.Entry into HistoryHistorically famous for being source of the Nile River.
The Conceptual Framework Additional Risk Factors affected by CC Water quality + quantity Food Security Add cc additional change to T, P T P Science Changes in Risk Agent Target population exposure Risk Malaria Risk agent source Data Integration GIS Cholera Policy + Actions Exposure Existing Data (20) Demonstrating priority health risks Risk Management + Adaptation options Source KEY: CC=Climate change; T P = change in temperature and precipitation; 2o = secondary data = strong linkage = hypothetical linkage
The Conceptual Framework assumes:- • That the project has a science component that can be integrated into policy and mitigation. • The science will inform policy by identifying the risk of the target population and their copying mechanism. • The relationship between precipitation and temperature to malaria and cholera explored hypothetically. • That the project encompases integrated vulnerability assessment, adaptation policy and implementation of an adaptive project.
2 Strategic Analysis - - - - - - - - - 3 Strategic Plan + Identification of options - (Multi-criteria Decision Making - - Preferred strategy 4 Implementation of Preferred ManagementOptions/ Strategy - - - - - - - Operation + Management Evaluation Monitoring of performance 1 Concept pre-planning - - - - - - - - Adaptive Feedback Beginning of Project T (year) KEY: - = see workplan (section 5.0) for detailed activities in each stage; t=time in years.
Research Questions1. What is the possible range of climate variables (scenarios) indicated by different climate change models in the Lake Victoria region? (see Figure 4) (Application of existing models)2. What is the relationship of malaria and cholera to climate variability (temperature and precipitation) in the Lake Victoria region?3. Which target groups are most vulnerable, i.e. how are sources of vulnerability differentiated within the population of the Lake Victoria region?4. What excess risk could be attributable to climate change? i.e. What are the possible ranges of malaria and cholera in the region given the different possible scenarios and what excess malaria and cholera risk could be attributable to these climate change scenarios?5. What are the existing and coping adaptation mechanisms and how can these be strengthened at the community level to cope with the possible range of excess risk? i.e. What are the possible adaptation strategies at the community level?
JustificationVery few studies on climate and water resources impacts on health have been undertaken in the East African region. This project will help fill the gap. It will assess vulnerability of communities to climate variability and change and adaptation mechanisms that can be incorporated in policy. It will enhance the capacity of scientists and institutions involved in the project.
METHODOLOGYa) To characterize baseline temperature and precipitation variability and apply existing climate change models to the region in order to estimate possible perturbations to those conditions. · Rainfall is highly seasonal in the region. The rainfall and temperature will be for specific season (s).· Climate data (rainfall and temperature) covering the period 1961 to the present will be collected from meteorological stations in the Lake Victoria basin.· Statistical downscaling capacity is available and shall be used. Some regional climate models are also available in the region.· A statistical analysis will be run of the time series data in order to estimate the probability distribution functions for temperatures and precipitation for each decade (baseline variability for 1960-70, 1970-80, 1980-90, 1990-2000). Descriptive statistics will be determined (mean, mode, median, standard deviation). Baseline is the state before any climate change variability is imposed.
· Downscale the outputs of the climate models and scenarios of changes in extreme (the El-Nino years and La Niña years) and to assign probabilities to extreme events. · Apply the common IPCC method of running ensemble of GCM projections with a set of scenarios. The ensemble models that have been recently used in the regional studies include the Canadian CCM, UKMO, GFDL Ver 2 and 3; and Japanese climate model. · Use some regional climate models that are available. (e.g Ssemazi, et.al.) · Selected climate change models will be used to estimate possible changes to baseline conditions i.e. perturbations to temperature and precipitation. · Use a range of increasing and decreasing synthesis of extreme seasonal rainfall and temperature scenarios, and some of the observed extremes and trends. The possible envelope of future climate scenarios will be drawn paying attention to extremes and if possible the relative probability of different scenarios
+20% P, CC ModelsScenario Envelope +10CT - 10%P M, c Now T (yr) Where : P = historical changes in precipitation M = historical changes in malaria C = historical changes in cholera
b) To improve our understanding of the dynamic relationships between changes in temperature and precipitation, and changes in malaria and cholera risk.· Historical data on malaria and cholera incidences will be obtained from medical centres in the Lake basin region.· GIS layers will be constructed to provide the spatial distribution of key variables; temperature (T), precipitation (P); malaria (M) and cholera (C) incidences. These maps will allow us to select the candidate pilot sites – those sites demonstrating high variability in climate and disease indicators.· The temporal relationship between the variables will be explored by comparing time series data of P and T for each station and M and C incidence for the areas surrounding each station. Daily values will be plotted and compared in order to capture the signal coupling between climate and disease data.
· For malaria, data on vector habitat, numbers and distribution changes will be collected and incorporated into a GIS layer. This will allow us to explore the relationship between these vector-related parameters, climate parameters and disease indicators.· For cholera, data on location of water bodies (streams, rivers, lakes) and wetlands (swamps) will be plotted on a GIS layer using existing maps and remotely sensed imagery as appropriate. Relevant cholera habitat indicators such as water, temperature and quality (alkalinity, algal blooms) will also be plotted on a GIS layer. Existing hydrological data on river flooding will be collected and plotted on a GIS layer. This is because river flooding is also a risk factor for cholera.
c) In order to understand the sources of vulnerability, the following information will be gathered:- time -activity pattern of exposure to risk agents- socio -economic household risk factors- access to health facilities- access to water, water quality and stagnant water bodies- disease awareness, perceptions and attitudes- malaria and cholera incidences per member of family- treatment and fatality from risk agents, etc.
GIS layers of temperature, precipitation, malaria, cholera incidences will be constructed for various community groups. Potential risk communities will be identified both through statistical data correlation and GIS maps. The identified communities will be engaged in the project through group participatory approaches.· Secondary data will be first collected from pilot communities to identify data gaps; these gaps will be filled by primary data from representative samples of the pilot populations. This information will be used to identify the target risk groups within the pilot populations, for example, by age, occupation or gender.· Socio-economic surveys by means of participatory approaches, focused group discussions, household interviews, field surveys and key informant interviews will be used to collect the relevant data.· Both primary and secondary data will be used to identify vulnerable (risk) groups.
· The previous information about climate and disease relationships will be used together with the following socio-economic data to better understand sources of vulnerability and adaptation capacities:- Awareness, perceptions and attitudes of stakeholders from local institutions and communities to climate-related human health problems especially malaria and cholera.- Anecdotal data on historical coping mechanisms, adaptation strategies and traditional knowledge of pilot communities.- Socio-economic characteristics of pilot communities (household resource endowments, poverty levels). This will be obtained from Household Welfare Monitoring Studies, Census and Statistical Bureaus and participatory interviews).- Data on water sources (wells, rivers, springs), water availability, use and management strategies at household level and hygiene practices.- The daily time activity patterns of the pilot communities.
d) To estimate the excess risk of malaria and cholera that may be attributable to future climate change.· Characterize baseline temperature and precipitation variability. These will be statistically correlated to incidences of malaria and cholera. We shall then apply climate change models described in section (a) to estimate possible perturbations to these conditions. Historical data on malaria and cholera incidences will be correlated with climate (T & P) data to evaluate the temporal relationship between the two sets of data.We shall use the following tools and models:- GIS software as spatial-temporal database data integration- Statistical analysis- MAGICC SCENGEN - ACRU model- SYSTAT PACKAGE/CLIMLAB 2000- COSMIC- GCM & models- Statistical and multiple regressions models.
Through statistical and multiple regression models, we shall correlate other factor such as land-use change and socio-economic factors.· Combining results from the analyses in (a) (baseline variability and future climate change scenario) and (b) (relationship between climate and disease), it will be possible to estimate the change in incidence of malaria and cholera attributable to climate change. In other words it will be possible to say by how much the incidence of malaria and/or cholera may change with a given change in T and/or P.
a)To represent future scenarios the following will be done:· Use either statistical downscaling techniques and/or dynamical downscaling with regional climate models; average daily precipitation and maximum and minimum temperature over the baseline period 1961 to 1990 at spatial resolution of 0.5 x 0.5 degree 50km sq to identify climate variables.· Using the regional data sensitivity scenarios of climate change we shall develop the scenarios for annual uniform warming of 2degree C, 4degree C and 5degree C and no change in 2010 and 2050’s; the same warming with 5%, 10% and 20% increase in precipitation in 2010 and 2050’s will be analyzed. We shall use climate scenarios developed by IPCC SRES. We will not develop new scenarios models.· Statistical and multiple regression analysis will be used to correlate future diseases scenarios with changes in social, economic and land-use conditions.· To integrate data and knowledge types in a geographic information system to inform local and national policy making, and enhance stakeholder awareness.· Using the results from the GIS layers obtained in (b) it will be possible to represent future disease scenarios for presentation to policy makers.
f) To work with risk groups in the pilot communities to assess existing adaptation and coping strategies for malaria and cholera, and to identify alternative strategies that can accommodate the possible changes in risk.· In each pilot community, a working group representing the target risk groups will be formed and together evaluate the alternative adaptation and coping strategies for malaria and cholera. Multi-criteria decision making will be used to compare the different alternatives and select preferred adaptation strategies. · Design Strategic Action Plans (SAPs) for the preferred adaptation strategies.· Monitor disease incidences, hospital/clinic visits and diagnosis, household welfare indices and other socio-economic data gathered at pre and post application of adaptation strategies to evaluate responses.
g)To implement priority strategies to prevent and mitigate existing and potential risks, monitor the performance of the strategies, and adapt to changing conditions.· Meetings will be held with the national and regional government and local communities in order to present SAPs and mobilize resources to implement them.· Apply a “practice and attitude” pre-survey to a sample of the pilot population before implementation of SAPs.· Implement SAPs in each pilot community.· Monitor and evaluate performance of the strategies. Future incidences of malaria and cholera will be used as indicators of the effectiveness of the preferred strategies.· Carry a post implementation “practice and attitude” survey.· Present performance results to the policy makers and local communities and modify and or adapt accordingly.