Download
1 / 24
240 likes | 348 Views
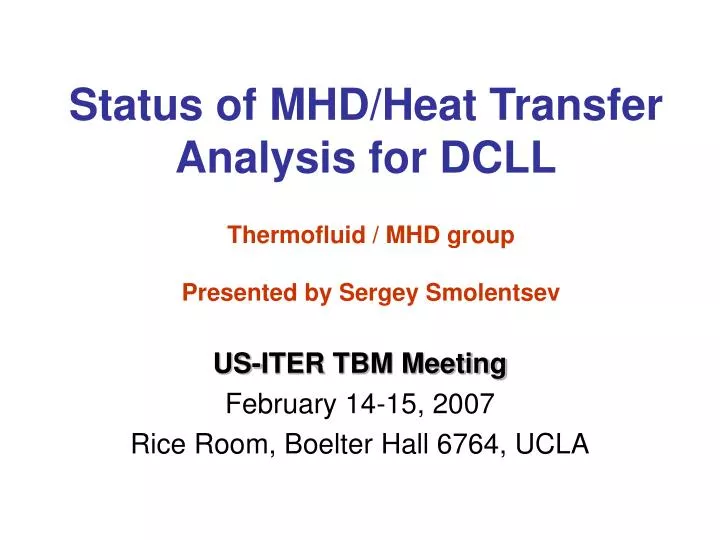
Status of MHD/Heat Transfer Analysis for DCLL. Thermofluid / MHD group Presented by Sergey Smolentsev. US-ITER TBM Meeting February 14-15, 2007 Rice Room, Boelter Hall 6764, UCLA. Layout. Conclusions from the previous MHD/Heat Transfer analysis for DCLL

E N D
Status of MHD/Heat Transfer Analysis for DCLL Thermofluid / MHD group Presented by Sergey Smolentsev US-ITER TBM Meeting February 14-15, 2007 Rice Room, Boelter Hall 6764, UCLA
Layout • Conclusions from the previous MHD/Heat Transfer analysis for DCLL • MHD phenomena and scaling analysis for poloidal ducts • New analysis for the DCLL DEMO blanket • Status of DCLL-related R&D
Conclusions from the previous analysis, 1 • Many results for DCLL had been obtained prior to the External Review Meeting at ORNL (Aug. 15-16, 2006) • The analysis covered MHD/Heat Transfer issues for DCLL DEMO and ITER TBM • 20-page TBM Tech. Note SS2, Rev. 1, S. Smolentsev, “Heat Transfer Analysis for DEMO, ITER H-H and D-T”
Conclusions from the previous analysis, 2 • High exit temperature (700C) is achievable • FCI provides reasonable MHD pressure drop reduction. • The design window appears to be very narrow. Reference parameters: SiC=100 S/m and kSiC=2 W/m-K • Serious concerns still remain on the PbLi-Fe interface temperature and FCI ΔT • Heat transfer is very sensitive to changes in the PbLi flows. Complex MHD phenomena, including 2-D MHD turbulence, buoyancy-driven flows etc., should be taken into account DEMO
Conclusions from the previous analysis, 3 • Both ITER scenarios in normal (and even abnormal) conditions look to be acceptable, i.e. all restrictions on the FCI ΔT and the PbLi-Fe interface T can be easily met • Flow/heat transfer phenomena in DEMO and ITER are expected to differ significantly, both qualitatively and quantitatively ITER H-H and D-T
=5 E D B A C g =100 DEMO =500 Summary of MHD/Heat Transfer phenomena in DCLL • Formation of high-velocity near-wall jets B.2-D MHD turbulence in flows with M-type velocity profile C. Reduction of turbulence via Joule dissipation D. Buyoncy driven flows E. Strong effects of MHD flows and FCI properties on heat transfer
Scaling analysis for poloidal ducts for ITER and DEMO ITER versus DEMO • The lack of neutrons and reduced PbLi • exit temperature in ITER (470C) are the • main reasons why ITER flow physics • differs from that in DEMO • The most pronounced differences are • expected in regard to buoyancy-driven • flows, which are significantly more • intensive under DEMO conditions • Smartly designed sub-module • experiment in ITER may result in data, • which can be extrapolated to DEMO • conditions (see N. Morley)
New dimensions New SHF and NWL New PbLi and He inlet/outlet T More detailed distributions for He flows 5, 2.5, 10 and 15 mm FCI Front, 1st and 2d return ducts 210 210 225 New analysis for DEMO, 1 What is new ? Cross-sectional area of the DCLL blanket with dimensions SHF = 0.58 MW/m2 NWL = 3.08 MW/m2 PbLi T in/out = 500/700C He T in/out = 350/450C
Effect of the FCI thickness on the MHD pressure drop: tFCI=2.5, 5, 10 and 15 mm; SiC=100 S/m Effect of SiC on the MHD pressure drop: SiC=5-500 S/m; tSiC=5 mm Heat transfer for the “reference ”case (tsic=5 mm, SiC=100 S/m, kSiC=2W/m-K, Ufront=5.8 cm/s, Urtrn=3.1 cm/s) for the front and two return ducts Heat transfer for the “reduced SiC” case (tsic=5 mm, SiC=20 S/m, kSiC=2W/m-K) for the front duct Heat transfer for the “turbulent” case (reference case parameters but the flow is turbulent) for the front duct S.Smolentsev, “Upgrades of MHD/Heat Transfer Analysis for DCLL DEMO, TBM Tech. Note TBM-SS3, 21 p., Feb.05, 2007 New analysis for DEMO, 2 What has been done?
Front duct. SiC=100 S/m. FCI: 2.5 mm FCI: 5.0 mm FCI: 10.0 mm FCI: 15.0 mm New analysis for DEMO, 3 Effect of the FCI thickness on the velocity profile
Front duct. tFCI=5 mm. SiC=500 S/m SiC=200 S/m SiC=50 S/m SiC=5 S/m New analysis for DEMO, 4 Effect of SiC on the velocity profile
New analysis for DEMO, 5 Effect of SiC and tSiC on the velocity profile Effect of the FCI thickness on the jet velocity, velocity at the duct center and in the gap.Front duct. SiC=100 S/m. Effect of the FCI electrical conductivity on the jet velocity, velocity at the duct center and in the gap. Front duct. 5 mm FCI. *All velocities in the tables are scaled by the mean velocity, i.e. 5.8 cm/s
Rwall RFCI RFCI Rgap ~ New analysis for DEMO, 6 Effect of SiC and tSiC on the MHD pressure drop R is the MHD pressure drop reduction factor Circuit analogy Electric current path “True” parameter, which describes the FCI effectiveness as electric insulator, is its “electrical resistance,” i.e. tFCI/SiC
New analysis for DEMO, 7 Reference case. MHD & Heat Transfer 2-D MHD and 3-D Heat Transfer computations for the DEMO blanket, including PbLi front and two return ducts. Reference case. Laminar flow. Computed velocity profile Cross-sectional temperature distribution at 1 m from the bottom Bulk temperature along the flow path
X=0.2 m X=0.8 m X=1.4 m X=1.8 m Front 1st return 2d return New analysis for DEMO, 8 Reference case. Temperature distribution in the poloidal ducts
New analysis for DEMO, 9 Reference case. Summary of Heat Transfer data
FCI 3 FCI 1, 2 Interface 3 Interface 1, 2 New analysis for DEMO, 10 Reduced SiC (20 S/m) case. Front duct. FCI ΔT. Interface T. 200 K 220 K 495C 560 C
FCI 3 FCI 1, 2 Interface 1, 2 Interface 3 New analysis for DEMO, 11 Turbulent case. Front duct. FCI ΔT. Interface T. 240 K 220 K 495C 560 C
New analysis for DEMO, 12 Comparison for the three cases. Front duct
New analysis for DEMO, 13 CONCLUSIONS • Temperature drop across the FCI and the maximum PbLi-Fe interface temperature is a concern • Thermal stress analysis should be performed for different flow conditions and FCI thicknesses • If the stress is too high, changes in the FCI design will be needed • Realistic maximum allowable interface temperature should be determined based on the corrosion/deposition considerations
PbLi FCI 2 FCI 1 New analysis for DEMO, 14 Suggested modifications in the FCI design (S. Malang) A. Double layer FCI B. Goffered FCI More stress tolerance Reduces ΔT in the FCI
Status of DCLL-related R&D, 1 • Two turbulence models for LM flows in a blanket have recently been developed. S. Smolentsev & R. Moreau, Modeling quasi-two-dimensional turbulence in MHD ducts flows, Proc. 2006 Summer Program, CTR, Stanford University, 419-430 (2006) • Scaling analysis for the PbLi flows in poloidal ducts (ITER and DEMO) has been performed (presented by N. Morley)
Status of DCLL-related R&D, 2 • Differential reduced-scale MHD sub-module has been proposed for testing in ITER (presented by N. Morley and C. Wong) • Manifold experiment and complimentary modeling are in progress (presented by K. Messadek and M. Ni)
Status of DCLL-related R&D, 3 • A problem for testing the pressure equalization effect has been formulated, and first 3-D runs started with HIMAG • Discussions on the initialization of the FCI/Heat Transfer experiment are in progress (K. Messadek & S. Smolentsev) • New round of studies for buoyancy driven flows in DCLL (2-D and 3-D) has been started