Download
1 / 9
90 likes | 96 Views
500. Saline. 400. 100µg rhVEGF 165 b. bevacizumab. 300. Tumor volume (mm 3 ). **. 200. **. 100. **. **. 0. 0. 4. 8. 12. 16. 20. Days after injection. B. A. PC3 cells. Control. VEGF 165 b. bevacizumab. C. D. *. **. 30. 25. 20. Vessels/mm -2. 15. 10. 5.

E N D
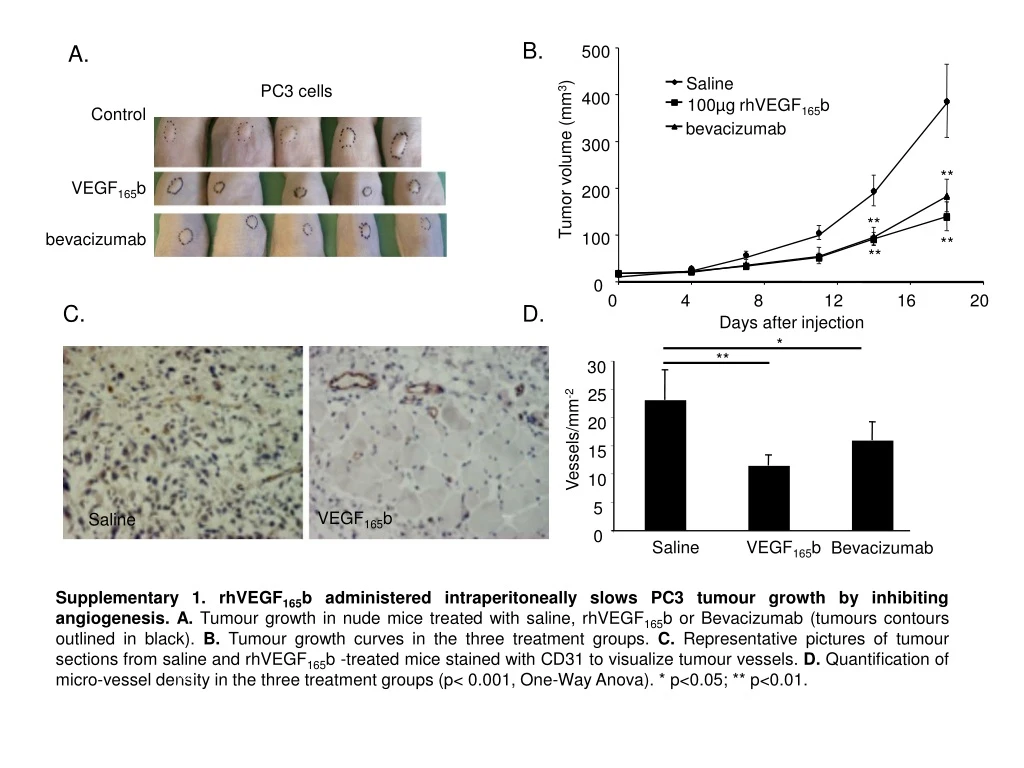
500 Saline 400 100µg rhVEGF165b bevacizumab 300 Tumor volume (mm3) ** 200 ** 100 ** ** 0 0 4 8 12 16 20 Days after injection B. A. PC3 cells Control VEGF165b bevacizumab C. D. * ** 30 25 20 Vessels/mm-2 15 10 5 VEGF165b Saline 0 Saline VEGF165b Bevacizumab Supplementary 1. rhVEGF165b administered intraperitoneally slows PC3 tumour growth by inhibiting angiogenesis. A. Tumour growth in nude mice treated with saline, rhVEGF165b or Bevacizumab (tumours contours outlined in black). B. Tumour growth curves in the three treatment groups. C. Representative pictures of tumour sections from saline and rhVEGF165b -treated mice stained with CD31 to visualize tumour vessels. D. Quantification of micro-vessel density in the three treatment groups (p< 0.001, One-Way Anova). * p<0.05; ** p<0.01.
SRPK1 KD CTRL 120 92kDa IB: SRPK1 100 80 IB: -actin SRPK1 fold expression (%) 45kDa 60 40 20 0 control SRPK1 KD A. B. Supplementary Figure 2. Quantification of SRPK1 KD in stable PC3 cells transduced with either control or SRPK1 shRNA lendiviral particles by qRT-PCR (A.) and Western blot (B.)
Control Control Control KD KD KD PAN VEGF VEGFxxxb VEGFxxxb/VEGFxxx A B C 0.5 3 1.2 2.5 1 0.4 2 Excess of anti-angiogenic isoform 0.8 0.3 VEGF (pg/µg total protein) 1.5 0.6 0.2 1 0.4 0.1 0.5 0.2 0 0 0 PC3 PC3 PC3 Supplementary Figure 3. SRPK1 knockdown triggers a switch in VEGF expression towards the anti-angiogenic isoforms in PC3 as assessed by ELISA for A. Total VEGF and B. VEGFxxxb expression relative to total protein or C. Ratio of VEGFxxxb to VEGFxxx expression. (calculated as VEGFxxxb/(VEGFtotal-VEGFxxxb)
SRPK1 shRNA CTRL shRNA A SRPK1 SR (1H4) SRSF6 SRSF5 SRSF1/2 α - Tubulin B SRSF4 (SRp75) SRSF6 (SRp55) mab104 SRSF5 (SRp40) SRSF1/2 (ASF/SF2/ SC35) SRSF3 (SRp20) α - Tubulin Supplementary Figure 4.SRPK1 knock–down alters phosphorylation of splice factors in PC-3 cells. Western blot analysis of extracts from control and SRPK1 KD PC3 cells. A. Expression levels of SR proteins are not affected. B. Phosphorylation levels of SRSF1, 2 and 5 are markedly decreased on SRPK1 KD cells.
900 600 Neuropilin1: 209bp 400 200 506 VEGFR1: 331bp 344 220 398 298 220 201 ladder PC-3 HUVEC -RT Water VEGFR2: 220bp Supplementary Figure 5. PC-3 cells express neuropilin 1, VEGFR1 and VEGFR2. RT-PCRs with specific primers on RNA isolated from PC3 cells and HUVECs as positive controls
5 4 3 2 1 SRPK1 copy no (x105 per µg RNA) CTRL A. B. SRPK1 KD R=0.7377 CTRL SRPK1 KD Tumour volume (mm^3) 2500 2000 1500 SRPK1 copy no (x105 per µg RNA) 1000 500 Supplementary 6. A. SRPK1 transcript quantitation in KD and control tumours as assessed by qRT-PCR. B. Correlation between tumour volumes and SRPK1 transcript number 1 2 3 4 5 6 7
0.100 0.090 0.080 0.070 0.060 Luciferase/Renilla 0.050 0.040 0.030 0.020 0.010 0.000 Wildtype shCtl shSRPK1 Supplementary 7. SRPK1 knockdown does not affect VEGF promoter activity. Luciferase driven by VEGF promoter (pGL4 backbone) was transfected in either wild-type, control shRNA or SRPK1 shRNA PC3 cells together with Renilla luciferase plasmid. No effect on VEGF promoter is seen.
SPHINXs compound validation using PC3 cell line IP: mab104 IB:SRSF1 PC3 SRPIN340 10uM SPHINX 7 1uM SPHINX 10uM Control kDa 37 25 Supplementary 8. PC3 cell were treated with SRPIN340 and SPHINXs compound for half an hour and protein extracted. The activity of SRPK1 was determined by estimating the expression level of p-SFSR1 via immunoprecipitation (IP) with Mab104 – an anti-phosphoSR antibody, and immunoblotting using SRSF1 antibody (Abcam)
NRP1 – AACATTCAGGACCTCTCTTGA NRP – AGGACAGAGACTGCAAGTATGAC VEGFR1 - AAATAAGCACACCACGC VEGFR1- ACCTGCTGTTTTCGATGTTTC VEGFR2 - AAAACCTTTTGTTGCTTTTGGA VEGFR2 - GAAATGGGATTGGTAAGGATGA Supplementary Table 1