Download
1 / 1
10 likes | 113 Views
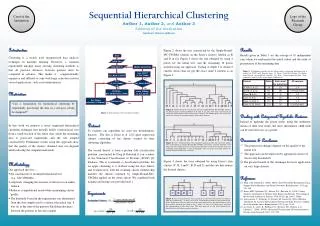
Supplementary material #4 for Figure 1C,D. PRE. POST. q12,2D. q12,2D. PRE. POST. q12,4D. q12,4D. PRE. POST. q24,4D. q24,4D. PRE. POST. q24,8D. q24,8D.

E N D
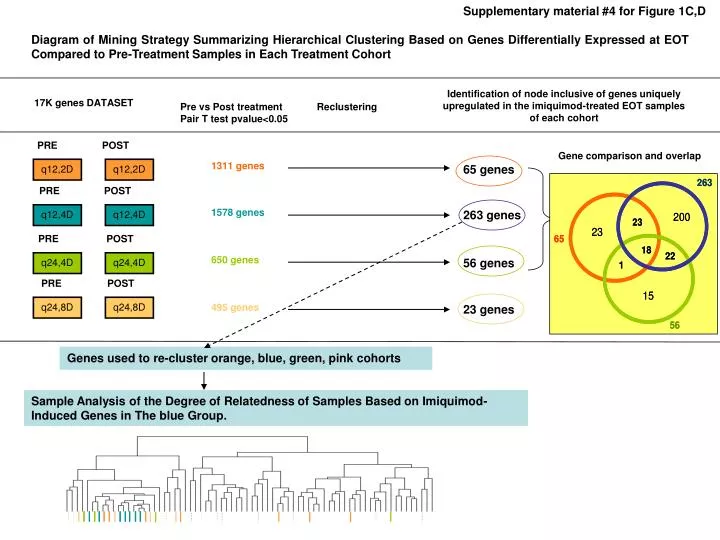
Supplementary material #4 for Figure 1C,D PRE POST q12,2D q12,2D PRE POST q12,4D q12,4D PRE POST q24,4D q24,4D PRE POST q24,8D q24,8D Diagram of Mining Strategy Summarizing Hierarchical Clustering Based on Genes Differentially Expressed at EOT Compared to Pre-Treatment Samples in Each Treatment Cohort Identification of node inclusive of genes uniquely upregulated in the imiquimod-treated EOT samples of each cohort 17K genes DATASET Pre vs Post treatment Pair T test pvalue<0.05 Reclustering Gene comparison and overlap 1311 genes 65 genes 1578 genes 263 genes 650 genes 56 genes 495 genes 23 genes Genes used to re-cluster orange, blue, green, pink cohorts Sample Analysis of the Degree of Relatedness of Samples Based on Imiquimod-Induced Genes in The blue Group.