Download
1 / 25
250 likes | 381 Views
New Tools for Visualizing Genome Evolution. Lutz Hamel Dept. of Computer Science and Statistics University of Rhode Island J. Peter Gogarten Dept. of Molecular and Cell Biology University of Connecticut. Motivation.

E N D
New Tools for VisualizingGenome Evolution Lutz Hamel Dept. of Computer Science and Statistics University of Rhode Island J. Peter Gogarten Dept. of Molecular and Cell Biology University of Connecticut
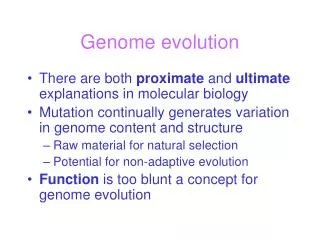
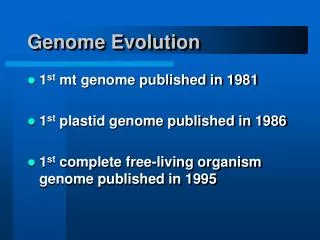
Motivation • Early life on Earth has left a variety of traces that can be utilized to reconstruct the history of life • the fossil and geological records • information retained in living organisms • Our research focuses on how information can be gained from the molecular record: • information about the history of life that is retained in the structure and sequences of macromolecules found in extant organisms • The analyses of the mosaic nature of genomes using phylogenetics will be a key ingredient to unravel the life's early history.
Relevance to NASA • The analyses are relevant in the context of NASA's Origin theme: • Understand the origin and evolution of life on Earth. • We address questions that are central to NASA's Astrobiology program: • Understand how past life on Earth interacted with its changing planetary and Solar System environment. • Understand the evolutionary mechanisms and environmental limits of life.
Phylogenetics Phylogenetics (Greek: phylon = race and genetic = birth) is the taxonomical classification of organisms based on how closely they are related in terms of evolutionary differences.
Phylogenetic progression as envisioned by Darwin From C. Darwin Origin of Species
B ACTERIA A RCHAEA Haloferax Riftia E.coli mitochondria Chromatium Methanospirillum Agrobacterium Chlorobium Methanosarcina Sulfolobus Cytophaga Methanobacterium Thermoproteus Epulopiscium Thermofilum Methanococcus Bacillus chloroplast pSL 50 Thermococcus Synechococcus pSL 4 Methanopyrus Treponema pSL 22 Thermus Deinococcus pSL 12 Thermotoga ORIGIN Aquifex Marine EM 17 pJP 27 group 1 pJP 78 SSU-rRNA Tree of Life E UCARYA Tritrichomonas Zea Homo Coprinus Paramecium Giardia Hexamita Porphyra Vairimorpha Dictyostelium Physarum Naegleria Fig. modified from Norman Pace Entamoeba Euglena Trypanosoma Encephalitozoon
Phylogenetics: Classic View • All genes are inherited from ancestor. • Branching reflects speciation events. • Evolutionary tree follows very closely the SSU-rRNA tree.
However… Aquifex is assigned to different branches of the tree… Science, 280 p.672ff (1998)
Horizontal Gene Transfer (HGT) leads to Mosaic Genomes, where different parts of the genome have different histories. (a) concordant genes, (b) according to 16S (and other conserved genes) (c) according to phylogenetically discordant genes Gophna, U., Doolittle, W.F. & Charlebois, R.L.: Weighted genome trees: refinements and applications. J. Bacteriol. (in press)
+ = + = Cartoons from Science Made Stupid, T. Weller, 1986. from http://www.besse.at/sms/ Evolutionary Processes Analogous to the Ones Proposed to Occur in the Microbial World
Visualizing Phylogenies • Visualize the relation of four organisms at a time • three unrooted trees • plot the support of various genes for each of the tree topologies in an equilateral triangle Orthologous Gene Families
Visualizing Phylogenies Synechocystis sp. (cyanobact.) Chlorobium tepidum (GSB) Rhodobacter capsulatus (-prot) Rhodopseudomonas palustris (-prot)
Constructing the Visualization “BLAST” every genome against every other genome Select top hit of every BLAST search Download four genomes (genome quartet) [a.a.sequences] Detect quartets of orthologs Align quartets of orthologues using ClustalW Convert probabilities (barycentric coordinates) into Cartesian coordinates Calculate maximum-likelihood values and posterior probabilities for all three tree topologies Plot all points onto equilateral triangle
Visualizing Five Genomes • Five genomes => fifteen unrooted trees • Rather than triangle - dekapentagon A: Archaeoglobus S: Sulfolobus Y: Yeast R: Rhodobacter B: Bacillus Zhaxybayeva O, Hamel L, Raymond J, Gogarten JP: Visualization of Phylogenetic Content of Five Genomes with Dekapentagonal Maps. Genome Biology 2004, 5:R20
Visualizing Multiple Genomes • Given this explosion, plotting all possible relationships as unrootedtrees is impossible. For comparison the universe contains only about 1089 protons and has an age of about 5*1017 seconds or 5*1029 picoseconds.
Visualizing Multiple Genomes: SOMs • SOM Self-Organizing Map • An artificial neural network approach to clustering • we are looking for clusters of genes which favor certain tree topologies • Advantages over other clustering approaches: • No a priori knowledge of how many clusters to expect • Explicit summary of commonalities and differences between clusters • Cluster membership is not exclusive – a gene can indicate membership in multiple clusters at the same time • Visually appealing representation T. Kohonen, Self-organizing maps, 3rd ed. Berlin ; New York: Springer, 2001.
Visualization with SOMs 4 11/4 11 12 9 15
Training a SOM Data Set SOM Neural Elements k y x mi SOM Regression Equations: • - learning rate - neighborhood distance SOM Visualization
1 - 5 6 - 10 11 - 15 Anatomy of a Trained SOM In our case k = 15 for the fifteen tree topologies.
Visualizing a Larger Number of Genomes • 13 gamma-proteobacterial • genomes (258 putative orthologs): • E.coli • Buchnera • Haemophilus • Pasteurella • Salmonella • Yersinia pestis (2 strains) • Vibrio • Xanthomonas (2 sp.) • Pseudomonas • Wigglesworhtia • Vibrio Cholerae There are 13,749,310,575 possible unrooted tree topologies for 13 genomes switch to bipartitions
95 Bipartition of a Phylogenetic Tree Bipartition – a division of a phylogenetic tree into two parts that are connected by a single branch. It divides a dataset into two groups, but it does not consider the relationships within each of the two groups. Here 95 represents the bootstrap support for the internal branch. The number of bipartitions for N genomes is equal to 2(N-1)-N-1.
Bipartitions: Lento Plot & SOM Strongly supported bipartitions Strongly supported bipartitions in SOM
Conclusions & Future Work • Self-Organizing Maps seem to be an effective way to visualize mosaic genome evolution. • Corroborate findings with other methodologies • Scalable • In the Future: • Larger data sets • Locally Linear Embedding (LLE)
Acknowledgements • Olga A. ZhaxybayevaDept. of Biochemistry and Molecular BiologyDalhousie University • Maria PoptsovaDept. of Molecular and Cell BiologyUniversity of Connecticut