Download
1 / 12
120 likes | 180 Views
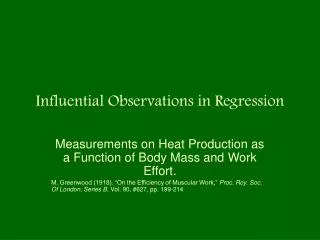
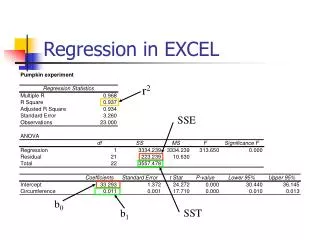
Influential Observations in Regression. Measurements on Heat Production as a Function of Body Mass and Work Effort. M. Greenwood (1918). “On the Efficiency of Muscular Work,” Proc. Roy. Soc. Of London, Series B , Vol. 90, #627, pp. 199-214. Data Description.

E N D
Influential Observations in Regression Measurements on Heat Production as a Function of Body Mass and Work Effort. M. Greenwood (1918). “On the Efficiency of Muscular Work,” Proc. Roy. Soc. Of London, Series B, Vol. 90, #627, pp. 199-214
Data Description • Study involved Algerians accustomed to heavy labor. Experiment consisted of several hours on stationary bicycle. • Dependent (Response) Variable: • Heat Production (Calories) • Independent (Explanatory/Predictor) Variables: • Work Effort (Calories) • Body Mass (kg) • Model: • H = b0 + b1W + b2M + e
Estimated Regression Coefficients • Note that that we can conclude, controlling for the other factor: • Work Effort increase Heat Production increases (p = .0136) • Body Mass increase does not Heat Production increases (p = .1957)
Plot of Residuals versus Fitted Values Huge, Positive, Residual
Diagnosing Influential Observations • Clearly, Observation #19 exerts a huge influence (although it has a small hat or leverage value, so it must be near center of Mass/Work observations • Upon further review to author’s original calculations provided in paper, the mean and S.D. are much to high for H (but exactly the same for M and W). • Could observation been a “typo”? • Try replacing H19=3936 with H19=2936 • Note: Do not do this arbitrarily, check your data sources in practice
Analysis with Corrected Data Point Note that both factors are significant, and that the intercept and body mass coefficients have changed drastically