Download
1 / 30
300 likes | 441 Views
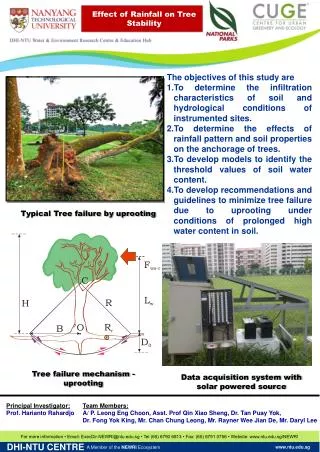
Impact of plot size on the effect of competition in individual-tree models and their applications. Jari Hynynen & Risto Ojansuu Finnish Forest Research Institute, Vantaa, Finland. Description of competition has major impact on model behavior

E N D
Impact of plot size on the effect of competition in individual-tree models and their applications Jari Hynynen & Risto Ojansuu Finnish Forest Research Institute, Vantaa, Finland
Description of competition has major impact on model behavior Correlation between observed competition and increment are affected by sampling > plot size effect statistical effect – sampling error when plot size in the modelling data differs from plot size in the simulation data correction method (Stage and Wykoff 1998) coefficients of the structural model are corrected in simulation according the plot size in the simulation data biological effect plot size vs. size of competition zone affects predicted stand dynamics affects comparisons between the simulated development of different treatment regimes Introduction
To empirically study the effect of alternative sample plot size on the description of competition in growth model (model parameters) in simulation results in Norway spruce dominated stands based on an extensive data from inventory growth plots Goal
Description of Competition Overall stand density: Relative density factor: RDF • describes the relative distance with respect to self-thinning line (Hynynen 1993) • expressed by tree species • calculated treewise self-thinning line: RDF=1.0 • Competitive status of a tree: • RDF of larger than subject tree: RDFL a stand with RDF=0.8
Norway Spruce stands in INKA data Modelling data • an objective sample of Norway spruce stands: Repeatedly measured inventory growth plots • 337 stands • 802 sample plots • 9300 tree measurements • one 5-year growth period from each stand were used • 4550 growth observations
sample tree plots tally tree plots stand Experimental design • Three systematically located sample plots within a stand • circular tally tree plots (36 trees/plot on the average) including • smaller concentric sample tree plots (10 trees/plot on the average) • Models were developed for trees on sample tree plots
Alternative sampling applied in the estimation of stand density variables • Sample 1: RDF and RDFL calculated separately for each sample plot • 10 trees/sample • 116 m2 sample area model Variant 1
Alternative sampling applied in the estimation of stand density variables • Sample 2: RDF and RDFL calculated separately for each tally tree plot • 36 trees/sample • 331 m2 sample area model Variant 2
Alternative sampling applied in the estimation of stand density variables • Sample 3: RDF and RDFL calculated frompooled data ofsample tree plots • 29 trees/sample • 337 m2 sample area model Variant 3
Alternative sampling applied in the estimation of stand density variables • Sample 4: RDF and RDFL calculatedfrompooled data oftally tree plots • 103 trees/sample • 964 m2 sample area model Variant 4
Individual-tree, distance-independent models were developed for tree basal area growth tree crown ratio of Norway spruce trees Models were developed for trees of sample tree plots Four model variants (Variants 1 to 4) were fitted to data with four alternative values of competition variables obtained from four different sampling (Samples 1 to 4) Model development
Model for tree basal area growth ln(ig)= a0+a1ln(d)+a2d2+a3(ln(d))2 +a4cr+a5cr(TS/1000) +a6RDFL2 +a7(ln(RDFNs+1)+a8(ln(RDFSp+1)+a9(ln(RDFbl+1) +a10(1/ln(Hdom)) + a11(1/Hdom2) + a12ln(SI) +a13SC1+a13SC1+a14SC2+a15SC4 + u + v +e tree dimensions competition stage of stand development site random parameters where d = tree diameter at breast height, cm cr = tree crown ratio TS = temperature sum, dd. RDFL = relative density factor of trees larger than subject tree RDFNs RDFSp, RDFbl= relative density factor of Scots pine, Norway spruce, and broad-leaved tree species Hdom= stand dominant height, m SI =site index of Norway spruce (index age 50 years), m SC1, SC2, SC4= categorical variable referring site types u = random stand effect v= random sample plot effect e= random effect of a tree
Variant 1 Variant 2 Variant 3 Variant 4 Variable Parameter values Intercept - 4.259 - 3.411 - 5.946 - 5.699 ln(d) 0.665 0.720 0.672 0.738 2 d - 0.0005 - 0.0004 - 0.0005 - 0.0004 2 (ln(d)) 0.183 0.143 0.175 0.133 cr - 0.678 - 1.036 - 0.696 - 0.716 . cr (TS/1000) 1.916 2.101 1.923 1.911 2 - 0.441 - 0.938 - 0.632 - 1.095 (RDFL) - 0.434 - 0.809 - 0.991 - 1.018 ln(RDF +1) Ns ln(RDF +1) - 0.704 - 0.555 - 1.041 - 0.972 Sp ln(RDF +1) - 0.444 - 0.357 - 0.916 - 0.425 Dt 1/(ln(H )) 6.622 5.718 7.682 6.184 dom 2 1/H - 23.107 - 20.922 - 27.859 - 22.904 dom ln(SI) Tree basal area growth model variants 0.476 0.453 1.029 1.222 SC1 0.196 0.268 0.270 0.356 SC2 0.144 0.187 0.171 0.179 SC4 - 0.029 - 0.104 - 0.135 - 0.123 var(u) 0.09697 0.09380 0.09271 0.08976 0.02573 0.02333 0.02163 0.02227 var(v) var(e) 0.2076 0.2048 0.2079 0.2055
The effect of relative stand density (RDF) on tree basal area growth of largest tree in a stand (RDFL=0)
The effect of relative tree size (RDFL) on tree basal area growth in a stand with high relative density
The effect of relative tree size (RDFL) on tree basal area growth in a stand with moderate relative density
Model for tree crown ratio cr= 1-e-f(x), in which f(x)=(a1-a11TH0-5).(Hdom)-a2 .da3 .exp(-a4RDF).TSa5 .SIa6 where d =tree diameter at breast height, cm cr = tree crown ratio TS = temperature sum, dd. RDF= relative stand density factor (incl. all tree species) Hdom= stand dominant height, m SI =site index of Norway spruce, m TH0-5= categorical variable referring recent thinning (< 5 years ago)
The effect of relative stand density on the predicted tree crown ratio
Model variants were added to Motti-simulator stand simulator based on individual tree growth models stand-level analysis tool for assessing the effects of alternative management practices The development of sample plots of a thinning trial were predicted with the model variants The simulation results were analyzed by comparing the results of model variants comparing the simulation results with measured stand development in stands with different management schedule Simulation study
Repeatedly measured spacing trial for Norway spruce located in southern Finland independent subjectively chosen treatments: four thinning intensities: 0,10,25,40 % of stand basal area removed three replicates plot size 1000 m2 established in 1961 37-year observation period (1961- 1988) 8 measurements One unthinned and one repeatedly thinned sample plot were chosen for simulation study Simulation data
Simulated and observed development of stand basal area in unthinned sample plot of Norway spruce
Predicted and observed yield of stand basal area in unthinned sample plot of Norway spruce
Simulated and observed development of stand basal area in repeatedly thinned sample plot of Norway spruce
Predicted and observed yield of stand basal area in thinned sample plot of Norway spruce
Relative difference between the predicted yields of thinned and unthinned sample plots
Competition effect is clearly affected by sample (and plot) size Overall stand density: increase in sample size increased the the effect of overall stand density Competitive status of a tree: the effect increased with increasing plot size sampling area cannot compensate the small plot size: Variants 2 and 4 (large plots) more sensitive to RDFL than Variants 1 and 3 (small plots) Conclusions (1/4)1) Model parameters
in unthinned stand: notable differences in the predicted total yield between model variants highest level of mortality predicted with model variant 1 largest overprediction of total yield obtained with model variant 1 (based on small plots) in thinned stand no major differences in the predictions between model variants all the models ended up in a slight overprediction Conclusions (2/4)2) Simulation results
Differences between the predicted development of different treatment regimes affected by model variant include biological and statistical effects affect the conclusions that are drawn from the comparison of alternative management regimes referring growth and yield the value of harvestable wood the profitability of forest management Conclusions (3/4)2) Simulation results (... continued)
Has major impact on the description of stand dynamics Sample tree plots of this study were too small for reliable description of the effective competition zone The impact remains small if spacing and size distribution is controlled by thinnings Conclusions (4/4)3) Biological plot size effect