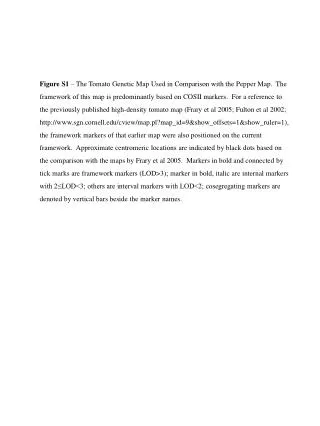
Download
1 / 8

E N D
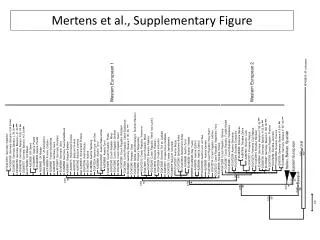
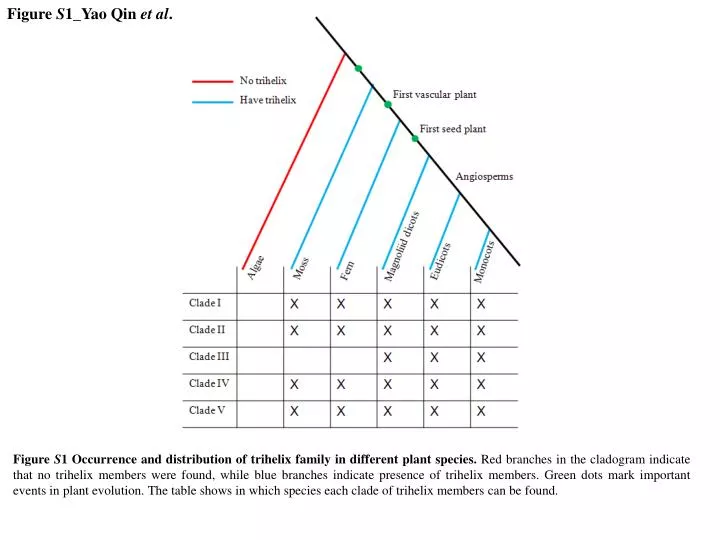
Figure S1_Yao Qin et al. Figure S1 Occurrence and distribution of trihelix family in different plant species. Red branches in the cladogram indicate that no trihelix members were found, while blue branches indicate presence of trihelix members. Green dots mark important events in plant evolution. The table shows in which species each clade of trihelix members can be found.
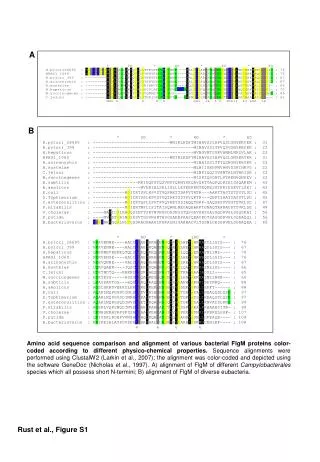
Figure S2_Yao Qin et al. α-1 α-2 α-3 * * * * Clade IN …… * * * * Figure S2 Sequence logo of the DNA binding domain of each clade. N, DNA binding domain at N terminal of clade I. C, DNA binding domain at C terminal of clade I. The trihelix domains were underlined by red. The fourth amphipathic a-helix, with the general sequence (F/Y)-(F/Y)-X-X-(L/I/M)-X-X-(L/I/M), is shown in green. The predicted coiled-coils motifs were underlined by blue. Clade IC * * * * Clade II …… * * * * Clade III …… * * * * Clade IV …… * * * Clade V …… 20 a.a
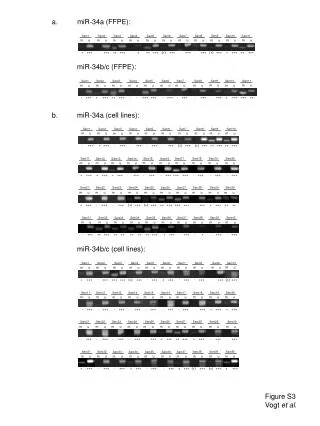
Figure S3_Yao Qin et al. Figure S3Genomic organization and colinearity of the trihelix family in rice, brachypodium and sorghum. Chromosomal localization of trihelix genes was indicated in each species. Green color represents for orthologous pairs between rice and sorghum, orange for rice and brachypodium, blue for brachypodium and sorghum.
Figure S4_Yao Qin et al. B C A Clade I Figure S4 Structural Analysis of Trihelix proteins in each clade Via phylogenetic analysis. (A) The constructed 3D structure of Trihelix by homology modeling by 2D alignment to template protein 2JMW. (B) Ramachandran plots of the Trihelix model. The different colored areas indicate “most favored allowed” (blue)” , and “additional allowed” (purple red) regions and the disallowed regions were marked in red plots. (C) Profile scores of the Trihelix mode. Each amino acid of Trihelix protein model was scored and the score above 0.2 was assumed to be confidential. Clade II Clade III Clade IV Clade V
AT1G76890 AT1G76880 AT5G28300 AT1G33240 AT5G03680 AT5G63420 AT1G13450 AT3G25990 AT2G38250 AT5G01380 AT1G21200 AT1G76870 AT3G10040 AT4G31270 AT1G31310 AT1G54060 AT3G14180 AT3G11100 AT5G05550 AT3G58630 AT3G24490 AT2G44730 AT3G54390 AT3G10030 AT4G17060 Figure S5_Yao Qin et al. I II V III IV Figure S5 Heat map of tissue specific expression profile of Arabidopsis trihelix factors using microarray data. Expression was presented by heat maps in blue/red colors generated using the meta-analysis tool at Genevestigator http://www.genevestigator.ethz.ch. The color intensity corresponds to the expression level. 9741 4821 5917 12156 2579 7624 6704 1157 5733 2371 2519 942 4718 4311 21869 6883 6638 4917 2270 2165 15430 8722 2284 6952 7728
AT1G76890 AT1G76880 AT5G28300 AT1G33240 AT5G03680 AT5G63420 AT1G13450 AT3G25990 AT2G38250 AT5G01380 AT1G21200 AT1G76870 AT3G10040 AT4G31270 AT1G31310 AT1G54060 AT3G14180 AT3G11100 AT5G05550 AT3G58630 AT3G24490 AT2G44730 AT3G54390 AT3G10030 AT4G17060 Figure S6_Yao Qin et al. I II V III IV Figure S6 Heat map of stimulated expression profile of Arabidopsis trihelix factors using microarray data. Expression was presented by heat maps in blue/red colors generated using the meta-analysis tool at Genevestigator http://www.genevestigator.ethz.ch. The color intensity corresponds to the expression level. 9741 4821 5917 12156 2579 7624 6704 1157 5733 4718 2519 942 21869 6883 6638 4917 2270 2165 15430 8722 2284 6952 7728
Os04g45750 Os02g01380 Os02g43300 Os03g02240 Os10g37240 Os02g33610 Os04g40930 Os04g51320 Os12g06640 Os11g06410 Os02g33770 Os01g21590 Os04g32590 Os02g31160 Os01g70230 Os03g46350 Os02g07800 Os05g48690 Os01g48320 Os04g36790 Os02g35690 Os01g52090 Os10g41460 Os08g37810 Os09g38570 Os04g45940 Os04g45940 Os03g18340 Figure S7_Yao Qin et al. I II III IV V Figure S7 Heat map of tissue specific expression profile of rice trihelix factors using microarray data. Expression was presented by heat maps in blue/red colors generated using the meta-analysis tool at Genevestigator http://www.genevestigator.ethz.ch. The color intensity corresponds to the expression level. 33884 60261 37641 41462 38918 74897 16678 26888 8895 37326 37772 1630 10790 4291 528 1720 23958 68381 65173 3616 60644 11187 133707 45782 33727 7458 300038 3012
Os04g45750 Os02g01380 Os02g43300 Os03g02240 Os10g37240 Os02g33610 Os04g40930 Os04g51320 Os12g06640 Os11g06410 Os02g33770 Os01g21590 Os04g32590 Os02g31160 Os01g70230 Os03g46350 Os02g07800 Os05g48690 Os01g48320 Os04g36790 Os02g35690 Os01g52090 Os10g41460 Os08g37810 Os09g38570 Os04g45940 Os04g45940 Os03g18340 Figure S8_Yao Qin et al. III I II IV V Figure S8Heat map of stimulated expression profile of rice trihelix factors using microarray data. Expression was presented by heat maps in blue/red colors generated using the meta-analysis tool at Genevestigator http://www.genevestigator.ethz.ch. The color intensity corresponds to the expression level. 33884 60261 37641 41462 38918 74897 16678 26888 8895 37326 37772 1630 10790 4291 528 1720 23958 68381 65173 3616 60644 11187 133707 45782 33727 7458 300038 3012